About
Today, the European Commission published the preliminary 2017 emissions under the EU’s Emissions Trading Scheme (ETS). Sandbag has analysed the data, and here we explain the key stories in 6 graphs.
EU ETS emissions
EU ETS emissions have risen for first time in 7 years
Dave Jones Global Programme Lead, Ember
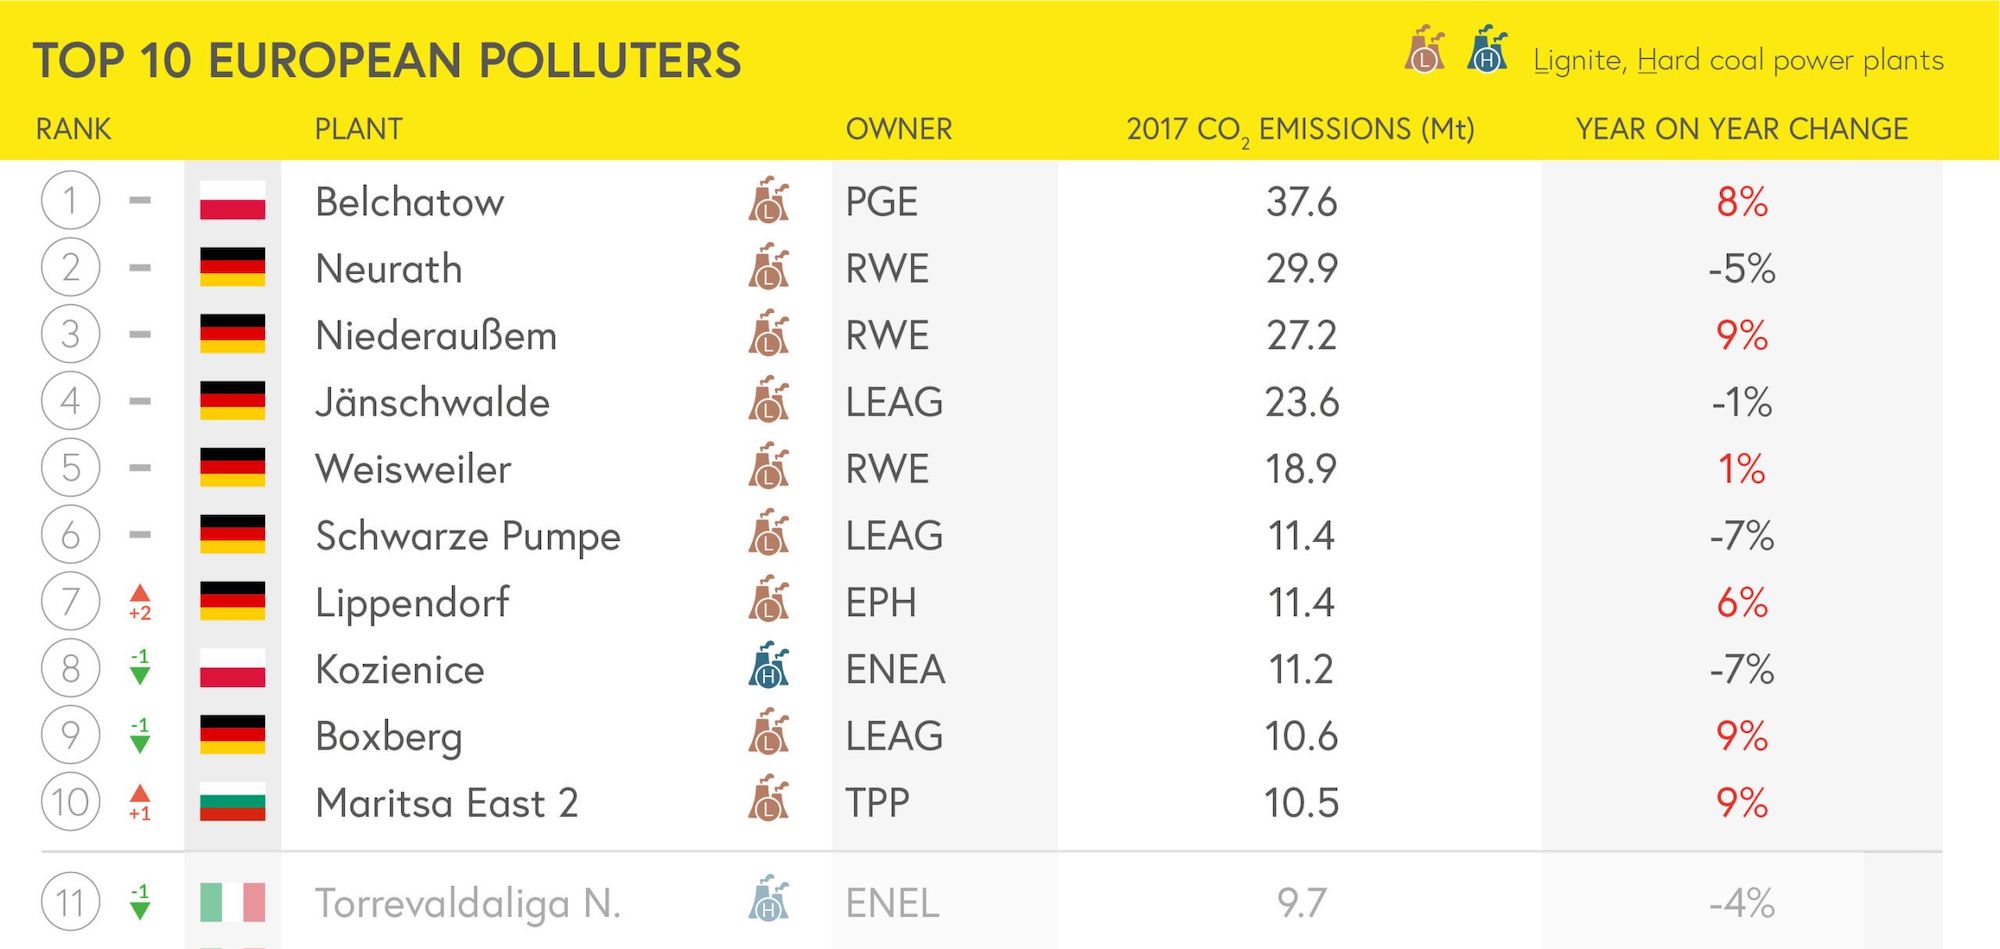
Today’s data shows a worrying rise in EU ETS emissions. The build-rate of wind and solar is not sufficient to rapidly decarbonise the power sector, especially as electricity demand increases and nuclear plants close. Still in 2017, 38% of EU ETS emissions were from coal power plants, and for the first time over half of these are from lignite, which has now overtaken hard coal emissions. The recent rise in the EU ETS price means most lignite plants are now likely unable to cover their high fixed costs, but due to other considerations they are slow to close, and due to their low variable costs they keep emitting even though they are uneconomic. So there is the potential to reduce emissions quickly, but this depends on a plan to deal with the increasing problem of lignite.

1. ETS emissions rose by 0.3% in 2017
Total EU ETS stationary emissions rose by 0.3% in 2017, according to our analysis of provisional data, from 1750 million tonnes in 2016 to 1756 million tonnes in 2017. This is exactly in line with our estimates: in January, Sandbag forecast 2017 emissions of 1756MT, in our report “Europe’s Power Sector Transition in 2017”.
The rise is the first rise in 7 years; in 2010 emissions rebounded slightly by 2% after a huge 11% fall in 2009. Emissions had been falling for an average of 2.7% per year for the first 11 years of the EU ETS – from 2005 to 2016.
The emissions data is 95% complete. We accounted for this by using 2016 emissions where there was incomplete data, unless the unit was registered as closed, in which case we recorded zero emissions.
As we also expect non-ETS emissions to have increased, specifically oil use for transport and gas use in space heating, overall EU emissions are likely to have increased in 2017.
2. Lignite and industry caused the rise in emissions
Industrial emissions rose for the first time since 2010 as industrial activity picked up and steel production rose.
Power sector emissions fell by only 1%. Power sector emissions had a tough year in 2017 as French nuclear production fell to its lowest level this century, as did EU hydro generation. Hard coal generation fell by 8% to 317MT as new wind turbines came online in UK, Germany, Netherlands and Denmark, displacing coal generation. Gas and other power plants emissions rose by 3% to 341MT, to fill the gap of low nuclear and hydro levels. The meagre fall of 1% in power sector emissions is despite a steep rise in wind generation: in fact, wind, solar and biomass generation rose above hard coal and lignite generation in 2017 for the first time.
More analysis on the power sector changes can be found in our report “Europe’s Power Sector Transition in 2017”.
3. Lignite emissions overtook hard coal emissions for the first time
Lignite (brown coal) emissions rose by 3% to 352MT, their first rise since 2012. For the first time lignite emissions overtook hard coal emissions (320Mt).
The main reason is that electricity demand is rising in many countries, and the deployment of wind and solar is not fast enough to meet this increased electricity demand and reduce lignite generation. The build-rate of wind and solar is not high enough to sustain falls in power sector emissions, especially as electricity demand increases and nuclear plants close.
Even in Germany which is still building a lot of renewables, lignite emissions only fell by 1%. The next 6 big emitting countries after Germany all saw increases in lignite emissions: Poland, Czech Republic, Greece, Bulgaria, Romania and Spain.
Lignite has very cheap variable costs which means it keeps emitting, despite that the plants are most-often uneconomic because of their huge fixed costs (see Carbon Tracker’s “Lignite Of the Living Dead report). The European Commission has launched a discussion platform to tackle transition problems away from especially lignite. However, it’s clear countries need a much more defined strategy to reduce their lignite emissions.
4. Industrial emissions rose by 2%
Industrial emissions rose by 2% to 743MT as the economy picked up. Almost all sectors increased. The biggest was a 5% increase in iron and steel emissions, where EU production saw its first increase for three years. Cement increased by 3%. Industrial production (IP) in the EU grew by 3.2% y/y over the whole year.
Industrial emissions have remained stubbornly high for the duration of the ETS, whilst power sector emissions have fallen rapidly, particularly in the UK. The EU urgently needs a new industrial strategy to bring about radical industrial process changes and/or carbon capture and storage, especially for the high-emitting steel and cement sectors.
5. Aviation emissions continued to rise
Ryanair continues as Europe’s largest emitting aviation company within the EU ETS. Total aviation emissions within the ETS (internal flights only) are now 64.8Mt CO2e.
Supporting Material
Acknowledgements
- Text and graphs: Dave Jones and Phil MacDonald
- Top ten infographic: Wilf Lytton
Insights
Related insights
See all insights
Draft NECPs show EU just falling short of REPowerEU
National targets on wind and solar need a final boost to deliver towards the EU’s renewable energy targets and emissions reduction commitments.
-
Europe
-
European Union
1 December 2023

A power sector analysis of draft NECPs
Rapid decarbonisation of the power sector is central to Europe’s decarbonisation and climate goals. This paper analyses 15 draft NECPs, exploring what they mean for progress towards a clean power sector in Europe.
-
Europe
-
European Union
-
Wind
-
Solar
1 December 2023
We use cookies
We use cookies to give you the best online experience. Please let us know if you agree to all of these cookies.
Yes = Allow all cookies
No = Allow only essential cookies
Cookies used on this site
-
These tools set cookies that store anonymised information about how you got to the site, and how you interact with the site.