

Highlights
US$34bn
Estimated fossil fuel costs avoided by 7 key Asian countries in the first half of 2022 due to solar generation.
5
Asian countries in top 10 for solar capacity globally in 2021.
+22%
Estimated average annual growth of solar capacity across 5 key Asian economies between 2021 and 2030.
About
This study explores the growth of solar power in seven key Asian countries, the potential for future growth and the avoided fossil fuel costs due to solar electricity generation between January and June 2022.
The report was jointly developed by Ember, CREA and IEEFA. It combines electricity generation analysis, energy generation cost estimates and in-depth policy assessments across China, India, Japan, South Korea, Viet Nam, the Philippines and Thailand.
Avoided fossil fuel costs for each country were estimated using actual power generation data from January to June 2022 from Ember’s Data Explorer. The report also estimates the potential cost of additional fossil fuel abatement if solar generation is expanded in line with each country’s solar power goals contained in their respective 2030 National Action Plans.
Finally, this analysis outlines the key policy challenges and opportunities for expanding solar power across the region, using a country-by-country policy assessment.
Executive summary
Solar generation helped avoid billions in costs for seven Asian countries
While gas and coal prices soared in 2022, the growth of solar power across China, India, Japan, South Korea, Viet Nam, the Philippines and Thailand helped avoid using costly fossil fuels.
Dr Achmed Shahram Edianto Electricity Analyst, Ember, Asia
Asian countries have shown that rapid solar deployment is possible, setting a remarkable example and providing valuable lessons learned for their peers in the region. As the prices of solar and storage plummet, and the potential cost savings have started to materialise, solar dominance in Asia now looks to come much sooner than previously expected.

Why Asian solar is crucial
Meeting Asia’s growing demand
Electricity demand is increasing more rapidly in Asia than anywhere else in the world.
As the last 12 months have shown, reliance on fossil fuels reduces energy security by exposing countries to the volatility of the market. This vulnerability has directly contributed to a rise in energy poverty and a slowdown in economic growth.
Solar capacity expansion is largely being driven by cost efficiency. According to IRENA, the levelised cost of electricity (LCOE) of new utility-scale solar panels fell by 88% over the last decade, with an average year-on-year reduction of 13%.
Renewables must be the cornerstone of cost-efficient, future resilient electricity systems. Given the region’s massive potential for solar, the growth of solar needs to be the priority in Asia’s energy transition and economic expansion.
Promising progress
Asian solar in the spotlight
Asia’s solar growth has happened under the radar, making quiet but substantial progress.
Cost-saving potential of solar
US$34 billion in fuel costs avoided January to June 2022
Solar generation in seven Asian countries helped avoid billions of dollars in fossil fuel costs during the first half of 2022.
Isabella Suarez Southeast Asia analyst, CREA
Asian countries need to tap into their massive solar potential to rapidly transition away from costly and highly-polluting fossil fuels. The potential savings from existing solar alone are enormous. Expediting their deployment alongside other clean energy sources such as wind, will be crucial for energy security in the region. While ambitious targets are important, follow through will be the key thing to watch moving forward.

Unleashing solar in Asia
Raising solar investments
Enabling policies are needed to attract investors, which in turn will drive solar capacity.
Energy finance analyst, IEEFA
A key challenge for successful solar expansion in Asia will include investments in grid stabilisation and energy market reform which, in turn, depend on how attractive solar is to investors. In the short-term though, cost elements such as capital costs, fuel costs as well as operations and maintenance costs will be critical to realise the region’s solar potential.

Thailand’s solar installations have stagnated recently, and the government has done little to turn that around.
In 2016, Thailand led ASEAN on solar investments, but has failed to keep pace with the rest of the region at just under 600 MW of new solar since then.
With a fairly robust grid, ample solar endowment, space, and a reasonably large domestic supply chain, solar power is on par with biomass incineration as the lowest cost energy in the country. This is especially true of floating solar power in the north of the country, which could easily connect to existing high voltage transmission lines.
But without a conducive policy environment, progress on installations has been slow, and many of the early leaders have gone on to become regional players in the solar market, such as B. Grimm and Thai Solar.
Thailand’s solar capacity is likely to expand, but without a concerted decarbonisation shift, any new capacity is likely to be additive, rather than replace the dominance of gas in the country’s energy mix.
The case for upping ambition
Making Asia’s electricity more accessible and secure
Solar power has the potential to help reduce expensive fossil fuel costs and imports, and increase energy security.
With solar consistently accounting for 0.06% of Indonesia’s electricity generation — the lowest of any country in the G20 — the country misses out on an opportunity to tap into its massive solar potential. Installed solar capacity in Indonesia is one of the lowest in Southeast Asia. Despite its small share, actual solar generation in Indonesia avoided US$10 million in fuel costs from January to June 2022.
Last year, the country committed to net zero by 2060 and a coal phaseout by 2050. To achieve this, renewables like solar will need to be built out rapidly.
At present, state-utility PLN’s National Electricity Supply Business Plan (RUPTL) has allocated only 4.6 GW of additional solar capacity between 2021 and 2030. If this target is implemented, Indonesia would need to build 23 times more capacity than the current level (210 MW). The planned increase in solar generation could already avoid at least US$788 million in fuel cost in 2030. However, this is a target that remains below existing solar capacity in Viet Nam (16 GW), the current leader of solar in Southeast Asia, and only slightly higher than Thailand’s (3.1 GW) current solar capacity.
With 200 GW of solar potential, Indonesia’s solar ambitions should be raised. According to the latest report by IRENA, Indonesia needs around 7 GW of additional solar capacity annually until 2030 to align with a 1.5C global heating scenario — more than 14 times of the current target. If Indonesia achieves this milestone, the country could avoid potential fuel costs of at least US$2.4 billion in 2030.
Coal has been the mainstay of Indonesia’s power mix and its economy, and the sector is a recipient of enormous regulatory and financial support. But such dependence has been costly.
From 2018 to 2021, the government provided subsidies to PLN amounting to IDR 197 trillion (roughly US$1.4 billion) and compensation funds of IDR 87.7 trillion (US$626 million) to cover the cost of electricity sales for non-subsidized groups. With record high commodity prices, the government’s estimated subsidy to PLN in the first quarter of 2022 alone was IDR 4.7 trillion (US$336 million).
Regardless of its significant domestic supply of fossil fuels, such subsidies are a significant portion of the national budget, which renewables can help alleviate as the country is becoming increasingly vulnerable to the fluctuations in global market prices.
Significantly raising the country’s solar target and investing in its implementation would be critical to achieving net zero in the electricity sector in Indonesia which, in turn, could offer reduced fuel costs and more affordable power bills for a lifetime.
Conclusion
Asia’s solar future
Asia’s major economies have ended the decade with a significant shift towards solar, and there are incredible savings to be made if the region can unlock its future potential.
While much of the region began the decade slow to realise the potential of solar power, a real shift over recent years has led to incredible savings in the first half of 2022 alone. By the end of the decade, China was not only on top of the world’s solar rankings, but five out of seven of Asia’s major economies made the top ten.
Thanks to the incredible growth of solar power, seven of Asia’s major economies avoided potential fossil fuel costs of US$34 billion over the first half of 2022. Considering the continuation of high coal, oil and gas prices in recent months, these savings are likely to have significantly increased.
Going forward, we expect solar’s growth curve to continue to increase this decade. While there are considerable challenges ahead, and a real need to transform the policy ecosystem across the region, solar capacity across five major economies could increase by 22% per year until 2030.
If this happens, and is balanced out with storage capacity and considerable investments to support grid interconnectivity and flexibility, we believe the cost savings opportunities are significant.
Based on current 2030 solar targets and the likely volatility of fuel prices, we predict that these major Asian economies could avoid at least US$44 billion — which is an additional US$10 billion — if this capacity is met in 2030. While realising these goals will require innovative reforms and collaboration with the private sector, it is clear that solar power is set to play a considerable role in Asia’s energy story over the next decade.
Supporting Material
Methodology
Ember's data
The data for this report is based on Ember’s yearly and monthly electricity dataset.
You can find the full methodology for underlying emissions, generation and capacity data here. Yearly and monthly electricity data is available for download in Ember’s data catalogue.
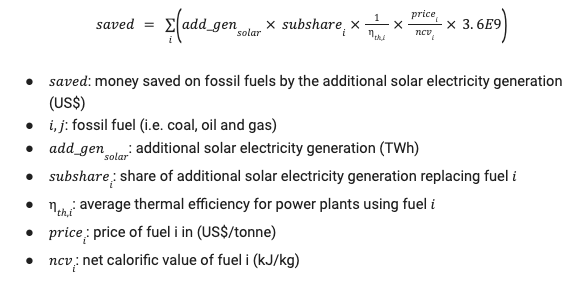
Fuel savings estimate
The formula to estimate the amount of fossil fuel saved by solar energy under various scenarios can be downloaded here.
The avoided costs are estimated based on each country’s actual power generation data for January to June 2022 from Ember’s Data Explorer. The potential avoided costs in 2030 uses the target solar generation of each country in 2030, as presented in their National Energy Plans.
| Country | Target share for solar in 2030 | Source |
| Thailand | 3%, calculated from target to add 8 GW solar by 2030 | Power Development Plan 2018 |
| The Philippines | 15% | Power Energy Plan 2020-2040 |
| Viet Nam | 11%. No additional solar capacity expected between 2021-30; share of solar is capped at H1 2022. | Power Development Plan VIII, May 2022 draft |
| South Korea | 8%, calculated from 34 GW solar target by 2030. | 9th Basic Plan for Long-Term Electricity Demand & Supply 2020-34 |
| India | 20% | CEA Report on Optimal Generation Capacity Mix 2029-30 |
| Japan | 16% | Sixth Strategic Energy Plan |
| China | 11% | Yuan Jiahai (Dec 2021). Pathway and policy for peaking CO2 emission in China’s power sector. |
| Indonesia | Scenario 1: Additional 4.68 GW of solar | PLN RUPTL 2021-30 |
| Scenario 2: Additional 66 GW between 2021-30 | IRENA Indonesia energy transition outlook 2022 |
The thermal efficiency of power plants is extracted from IEA World Energy Balances, and detailed in the table below:
| Country | Coal | Gas | Oil |
| China | 38.0% | 56.6% | 35.0% |
| India | 36.8% | 40.6% | 16.8% |
| Malaysia | 34.0% | 43.1% | 14.3% |
| The Philippines | 31.9% | 54.1% | 41.9% |
| South Korea | 38.3% | 55.1% | 39.3% |
| Thailand | 36.9% | 46.0% | 32.9% |
| Viet Nam | 30.9% | 50.7% | 49.6% |
Thermal efficiencies in Japan were not available in the original dataset; the thermal efficiency of plants in South Korea was used.
Net calorific value (NCV) of imported fuels is also considered, as the volume of imports would have likely had to increase if additional solar was unavailable. These NCVs are obtained from IEA World Energy Statistics, and detailed below.
| Coal Bituminous coal |
Natural Gas
|
Oil Diesel oil |
|
| China | 20.9 | 46.9 | 44.6 |
| India | 23.6 | 49.9 | 44.6 |
| Japan | 23.8 | 47.6 | 44.6 |
| Malaysia | 26.4 | 47.3 | 44.6 |
| The Philippines | 22.1 | 46.5 | 44.6 |
| South Korea | 23.7 | 50.3 | 44.6 |
| Thailand | 26.4 | 43.9 | 44.6 |
| Viet Nam | 23.4 | 46.6 | 44.6 |
Assumed Net Calorific Value of fossil fuels in MJ/kg.
According to the UN Comtrade Database, most of the steam coal (i.e. excluding coking coal) imported in these countries is bituminous coal. We therefore used the NCV of bituminous coal. We also assume that oil power generation is using diesel oil, with a NCV of 44.6 MJ/kg.
Solar/fossil fuel substitution
To estimate the amount of fuel saved by solar electricity generation, one needs to build a counterfactual scenario where the solar electricity generation is generated by other fuels instead. Here we assume that solar has replaced incumbent fossil fuel based electricity generation. For our estimation to be conservative, we assume solar has replaced the cheapest form of fossil-fuel based generation during that period (i.e. either coal, gas or oil) and for each country independently.
However, we use different assumptions for Indonesia. We assume solar has replaced oil first, then the cheapest form of fossil-fuel based generation during that period, as stated by the Ministry of Energy and Mineral Resources and PLN (state-owned utility company).
Fossil fuel prices
Fossil fuels are sold on a variety of contracts including fixed-price, indexed to average oil prices and indexed to other spot prices. This means that the price of fossil fuel is not directly proportional to the current spot price, and it may vary from one country to another.
UN Comtrade database provides trade data in both physical and monetary terms, allowing us to derive a monthly commodity price for each country separately. Commodities considered for t.
However, at the time of writing, 2022-H1 trade data is not available for every country (see table below).
| Coal | Gas | Oil | |
| China | March 2022 | March 2022 | March 2022 |
| India | July 2022 | July 2022 | July 2022 |
| Indonesia | March 2022 | March 2022 | March 2022 |
| Japan | August 2022 | August 2022 | August 2022 |
| Malaysia | December 2021 | December 2021 | December 2021 |
| The Philippines | June 2022 | June 2022 | June 2022 |
| South Korea | December 2019 | December 2019 | December 2019 |
| Thailand | December 2020 | December 2020 | December 2020 |
| Viet Nam | December 2020 | December 2020 | December 2020 |
Latest available dates in UN Comtrade Database at the time of writing.
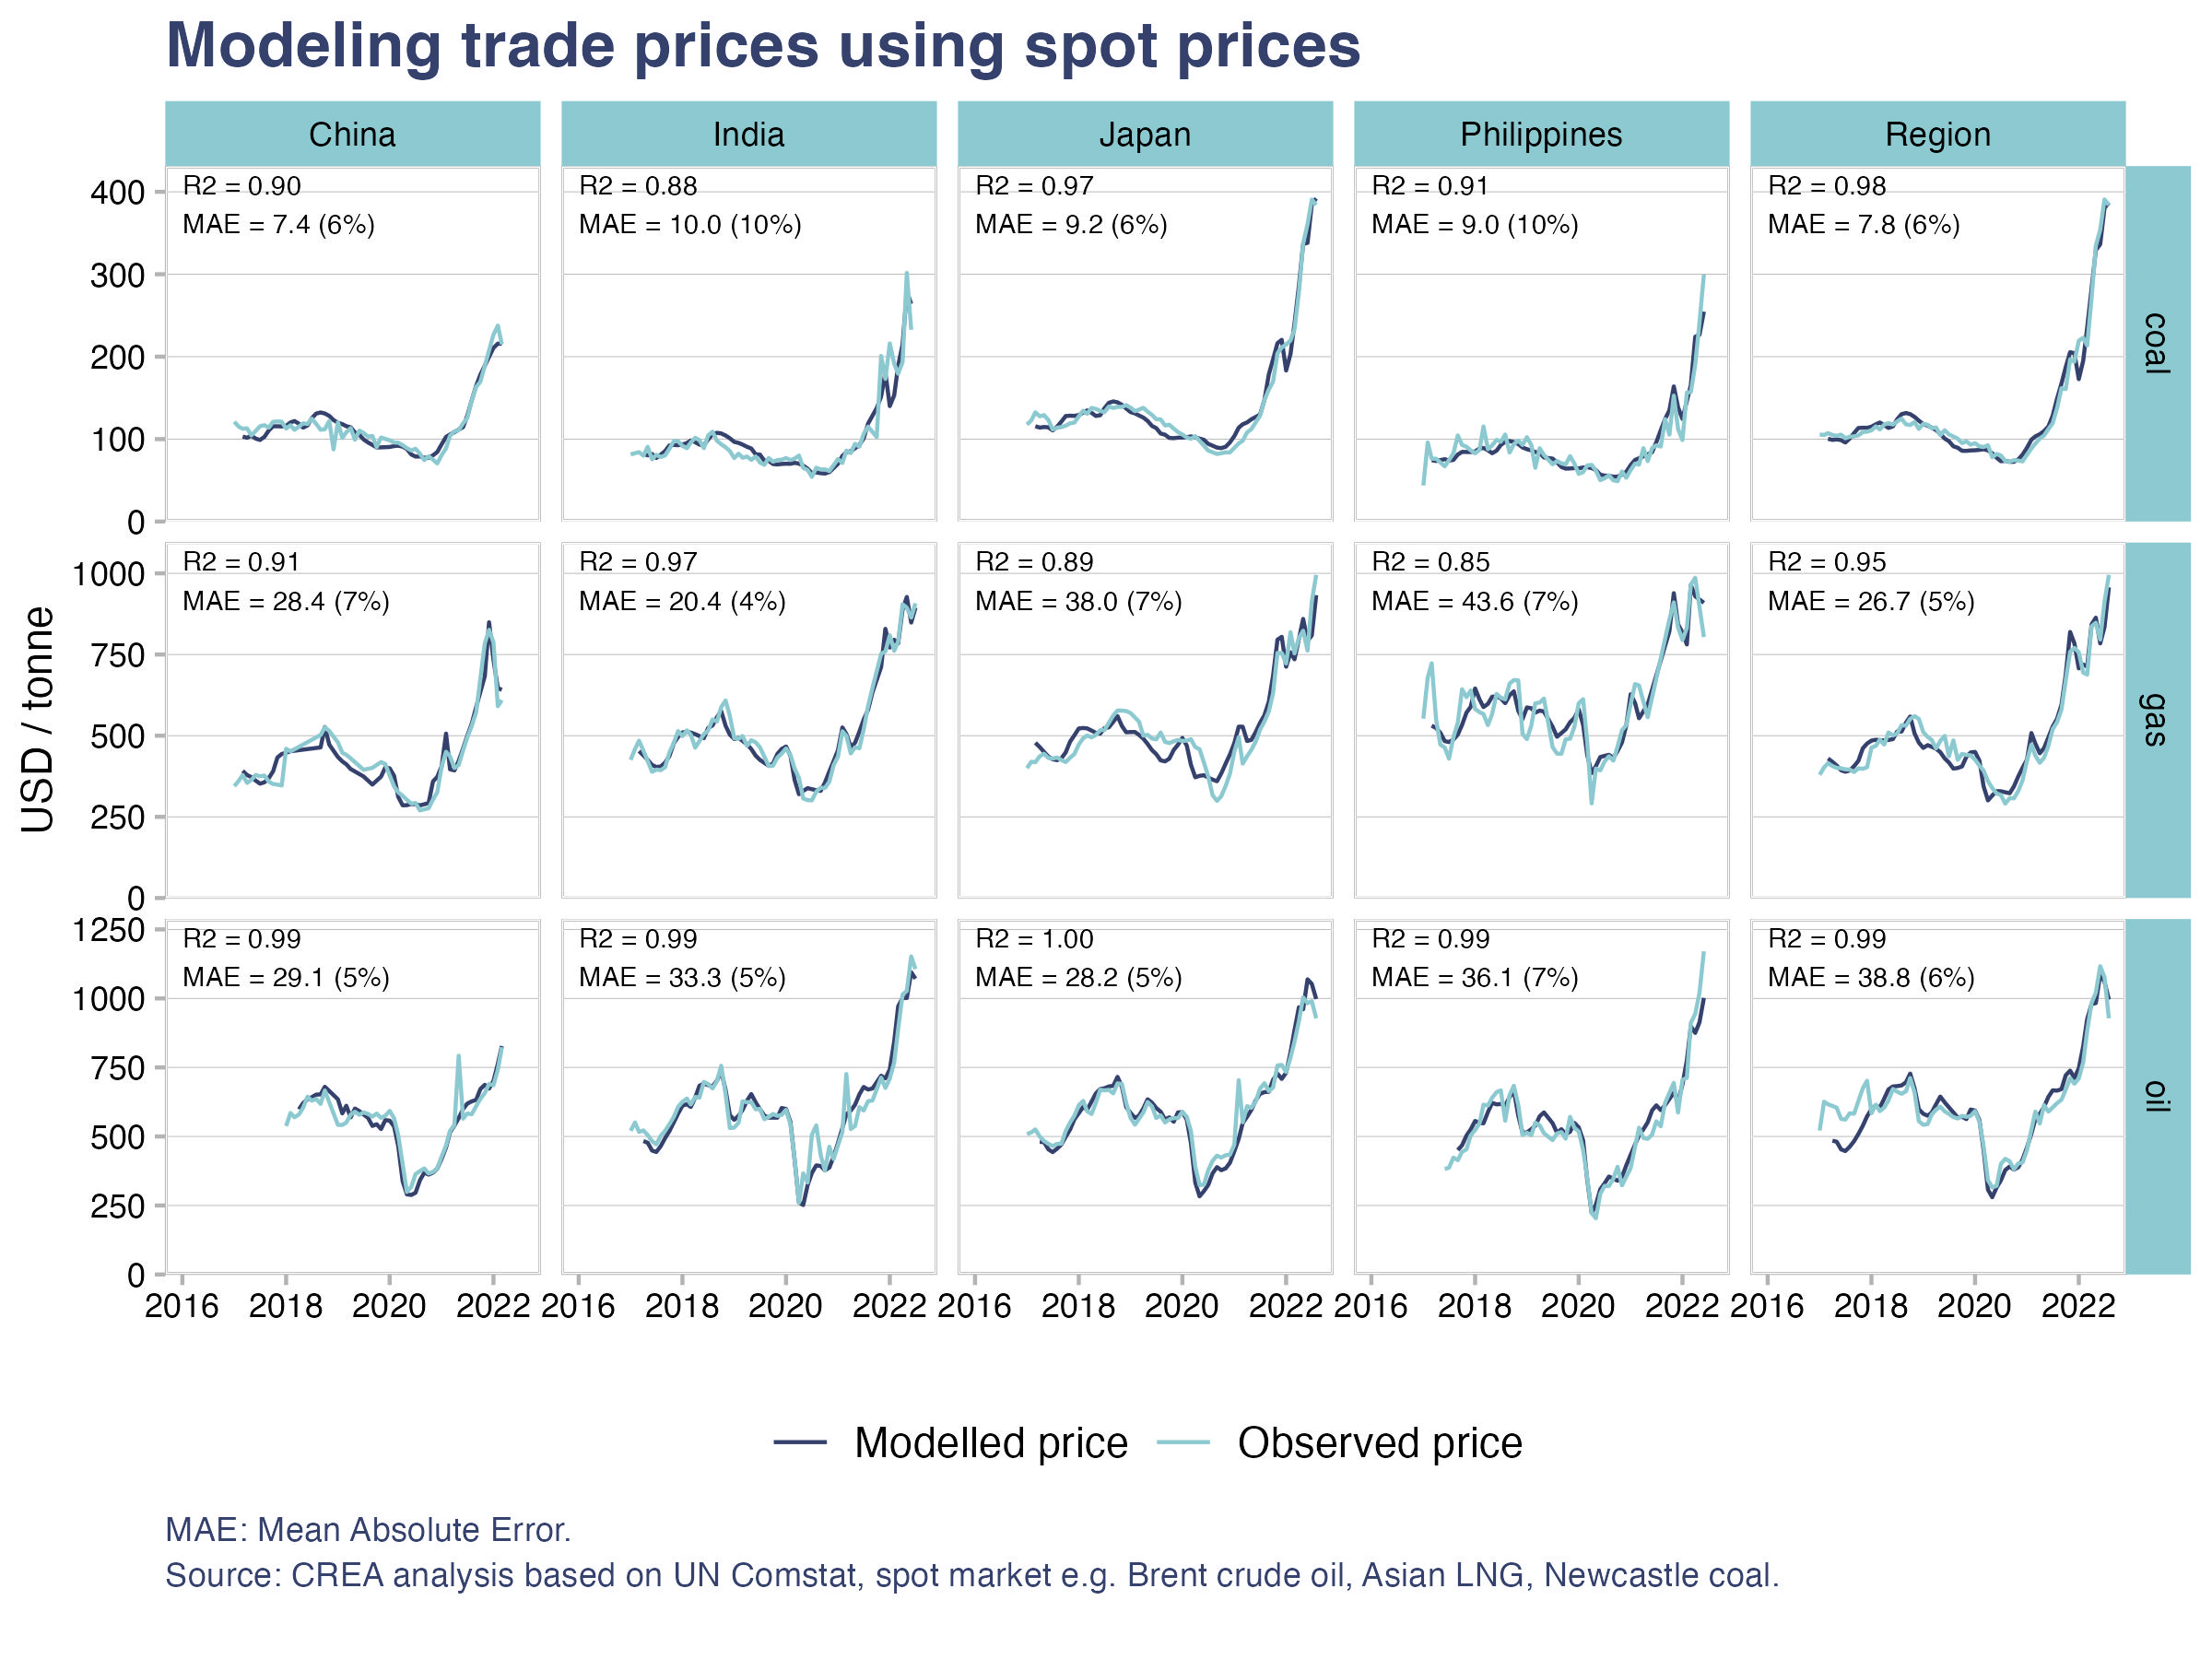
To estimate prices of displaced fossil fuel trades in 2022, we build linear regression models between historical prices and average monthly spot prices for the current month and with lags (Brent crude oil, TTF gas, Asian LNG, Newcastle coal futures). Models are built for countries individually (see Figure 2).
Commodities considered and their corresponding HS code are listed in the table below:
| HS code | HS description | |
| Coal | 270112 | Coal, bituminous. |
| Gas | 2711 | Petroleum gases and other gaseous hydrocarbons. |
| Oil | 2710 | Petroleum oils and oils from bituminous minerals, not crude. |
Malaysia, South Korea, Thailand and Viet Nam have not yet reported 2022 data. Therefore, the models for these countries did not capture the unusually high prices in 2022-H1. To prevent this from affecting results, the average fuel prices for the region was assumed for these countries. To further prevent model drift (i.e. model prediction beyond the domain it was trained on), we cap commodity pricing using the highest observed prices in the region.
The quality of model fitting is relatively good, with typical R squared greater than 0.9 and median absolute error within 10% of average price. Modelled trade prices chart can be downloaded here.
Prices in 2030
Avoided fuel cost estimates in 2030 use 2019 (low) and 2022 (high) commodity pricing as a reference for 2030 prices.
Bloomberg New Energy Finance
BNEF datasets were used in the financial and investment section of this report, which are available on this link. This is a paid service and will need a subscription to access. To subscribe, please contact BNEF on https://about.bnef.com/.
Acknowledgements
Achmed Shahram Edianto, Isabella Suarez, Norman Waite
Contributors- Analysis: Uni Lee, Aditya Lolla, Muyi Yang
- Data and data-viz: Hubert Thieriot, Chelsea Bruce-Lockhart
- Editorial: Rini Sucahyo, Chris Wright, Hannah Broadbent, Alison Candlin, Hannah Ekberg
Workers on the roof of a solar panel assembly factory, Solar Valley, Dezhou, China
Credit: Mick Ryan (Alamy Stock Photo)
Media Coverage
- The Independent
- Associated Press
- The Straits Times
- Eco-Business
- The Economic Times
- The Times of India
- Phil Star
- The Manila Times
- Anadolu Agency
- Press Trust of India
- CNBC TV 18
- Dhaka Tribune
- Business Standard
- The Indian Express
- The Federal
- The Hindu Business Line
- Koran Jakarta
- Kumparan
- Dunia Energi
- Báo Mới
- Vietnam+