
Highlights
38%
Renewables generated 38% of Europe's electricity in 2020, overtaking fossil-fired generation for the first time
10%
The EU-27 saw 10% growth in wind and solar generation in 2020
20%
Coal generation fell 20% in 2020, and has halved since 2015
About
This report compiles and analyses the full-year 2020 electricity generation of every EU country, tracking Europe’s electricity transition. This is the fifth year in a row that Ember (formerly as Sandbag) has done this analysis in conjunction with Agora Energiewende.
Executive summary
EU renewables overtake fossil fuels
Climate neutrality by 2050 means renewables growth will further accelerate.
Dave Jones Senior electricity analyst, Ember
It is significant that Europe has reached this landmark moment at the start of a decade of global climate action. Rapid growth in wind and solar has forced coal into decline but this is just the beginning. Europe is relying on wind and solar to ensure not only coal is phased out by 2030, but also to phase out gas generation, replace closing nuclear power plants, and to meet rising electricity demand from electric cars, heat pumps and electrolysers.
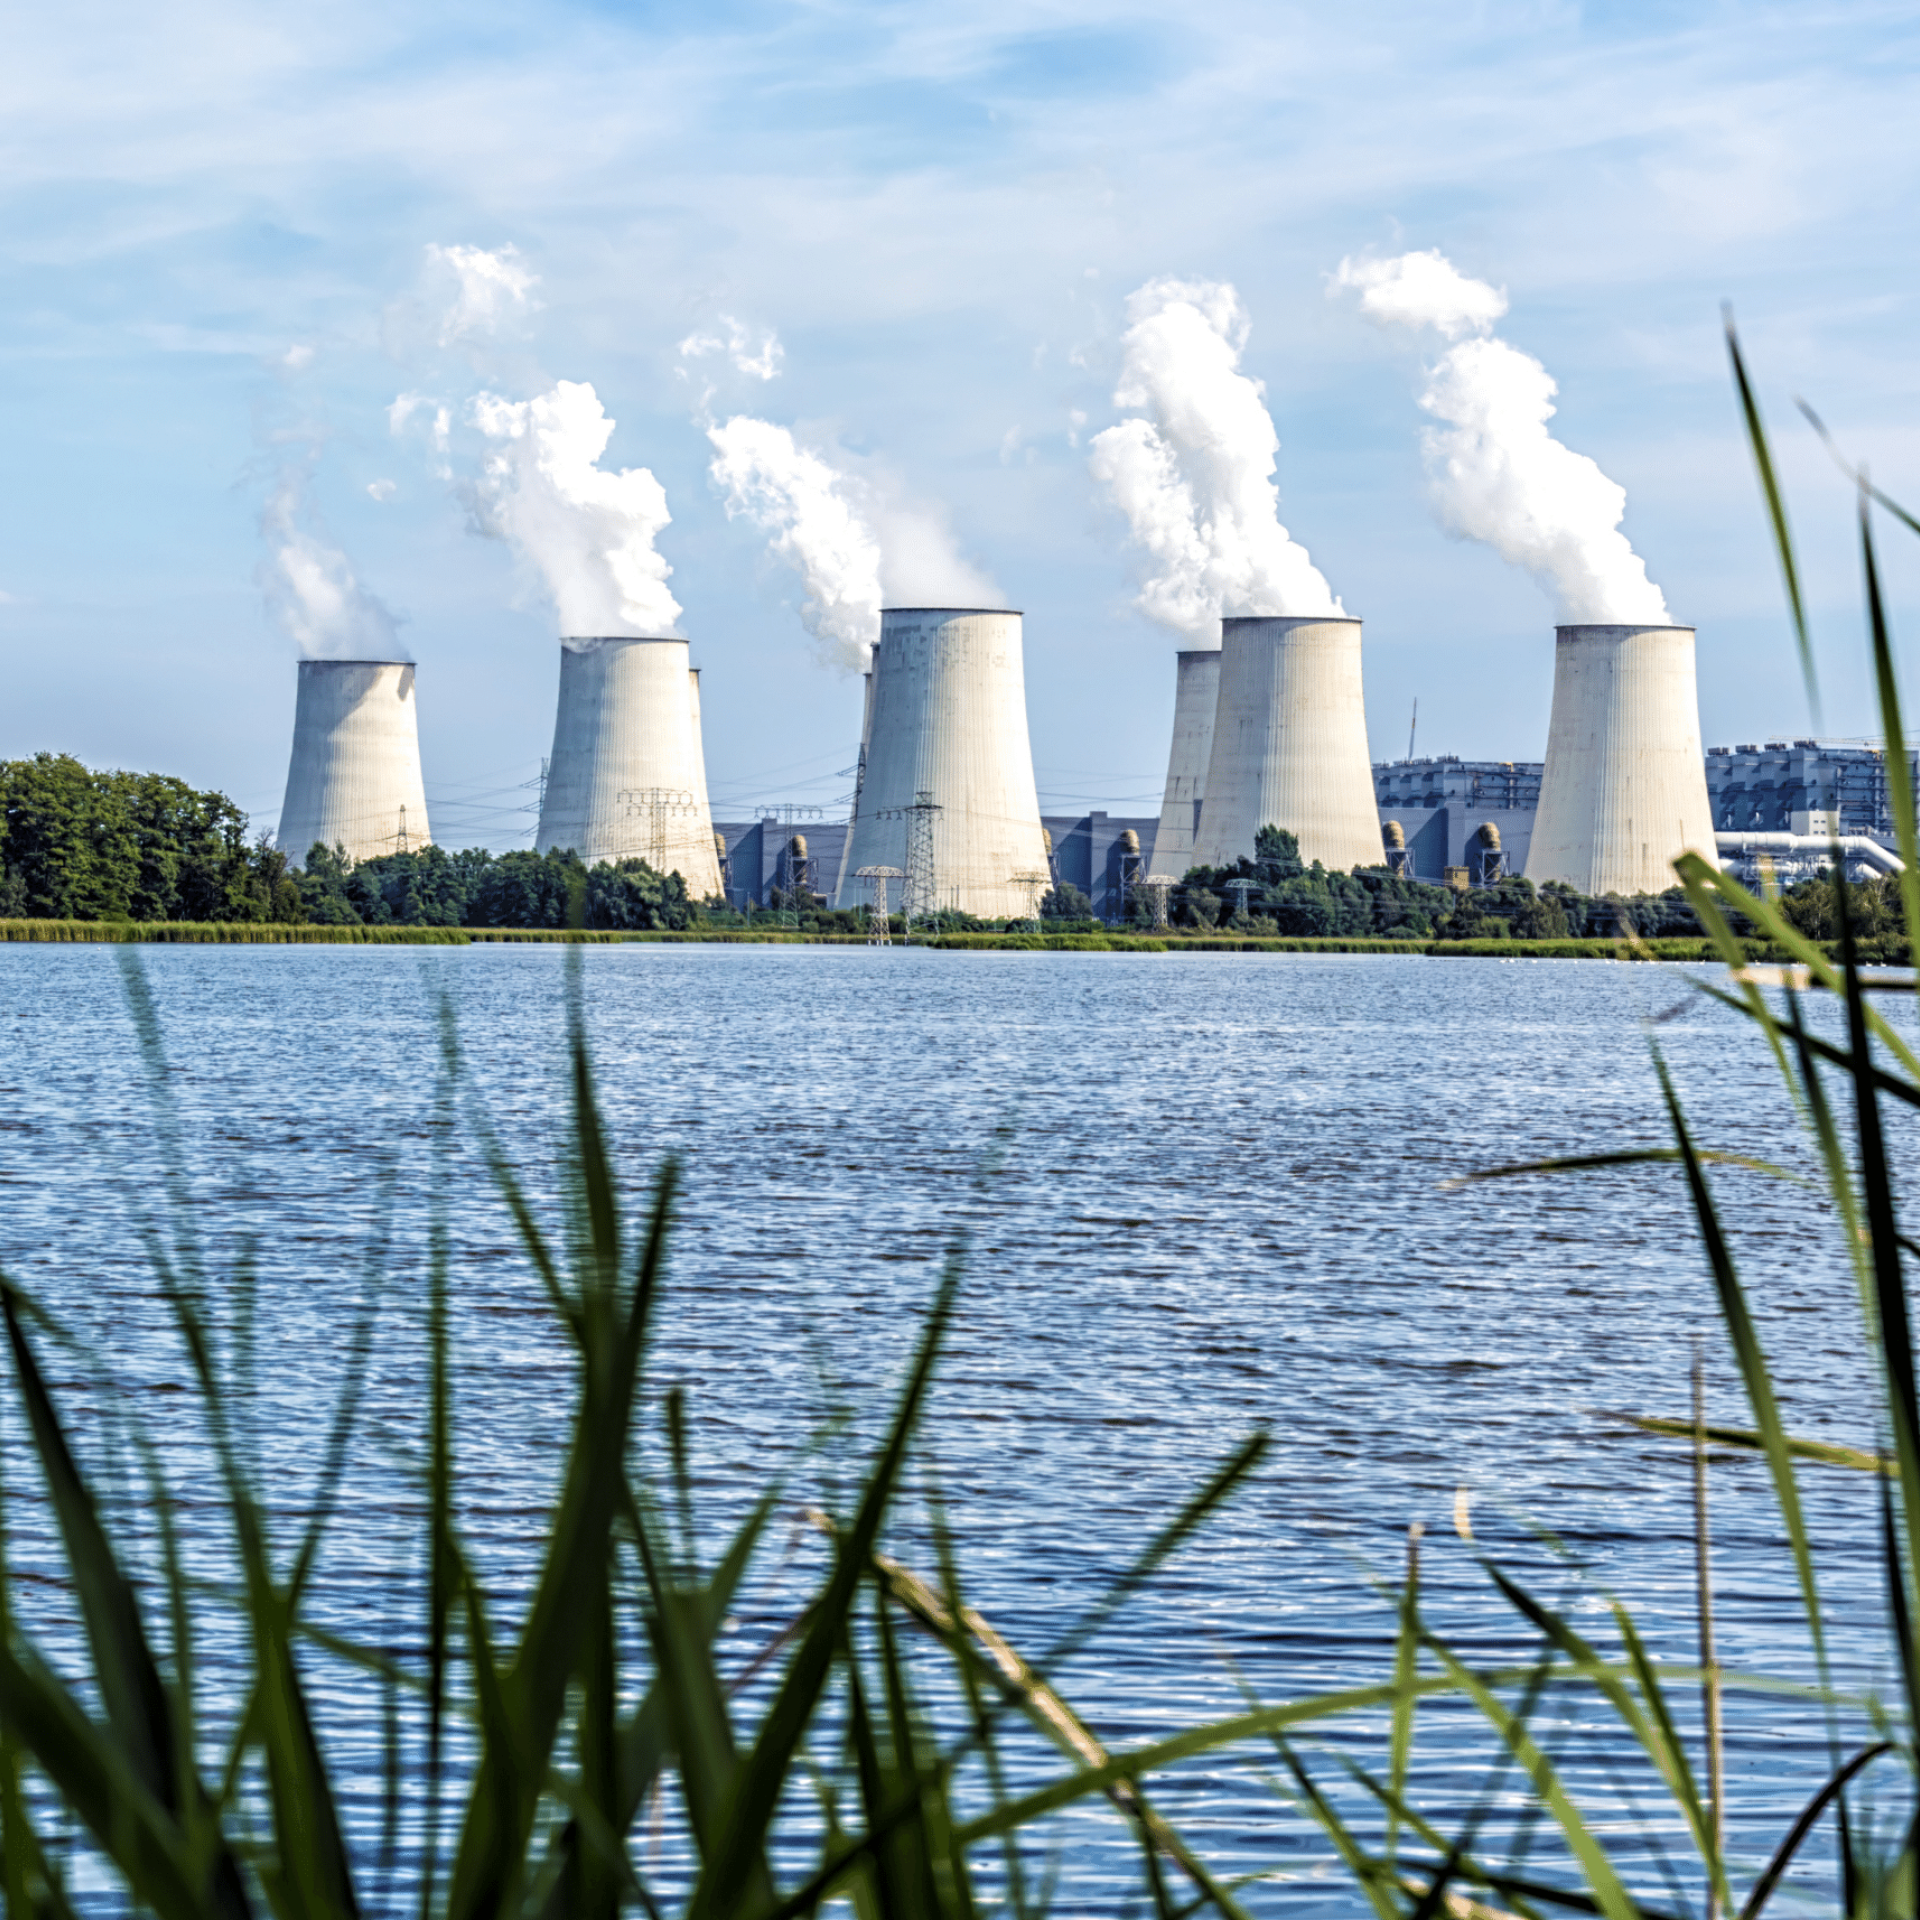
Rising Renewables
Renewables are now the EU's largest source of electricity
Wind and solar have powered Europe’s renewables rise.
Note – for the purposes of this report, renewables are classified in line with the IPCC and include bioenergy. However, the climate impact of bioenergy is highly dependant on the feedstock, how it was sourced and what would have happened had the feedstock not been burnt for energy. The current EU bioenergy sustainability criteria do not sufficiently regulate out high-risk feedstocks and therefore electricity generation from bioenergy cannot be automatically assumed to deliver similar climate benefits to other renewables sources (such as wind and solar) over timescales relevant to meeting the commitments of the Paris Agreement. For more information please see Ember’s reports: The Burning Issue (June 2020) and Playing with Fire (December 2019).
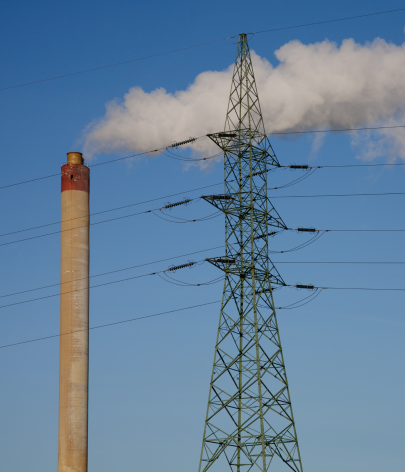
Falling Fossils
Coal fell by 20%, but gas barely fell despite Covid-19
Coal generation fell 20% in 2020, and is now half that of 2015.
Supporting Material
Methodology
Data methodology
The data in this report is curated by Ember. The full dataset is available from this excel file.
For 2000 to 2018, the data is from EUROSTAT (nrg_bal_peh). 2019 and 2020 data is our ‘best view’ of what the Eurostat data will be when it is published. We do this by estimating the year-on-year changes for each year, and adding them onto the 2018 Eurostat figures.To estimate these changes we rely mainly on Ember’s monthly curated data for Europe from ENTSO-E data, and cross-check these changes against any available monthly data from Eurostat, and data from national TSOs. For Germany we use AG-Energiebilanzen for all years. Note: all data used is “gross” not “net”.
As always, Entso-E data is far from perfect, so the process of estimating yearly changes is an art of piecing together multiple data sources. Notable issues with Entso-E are the classification of fossil generation in NL and IT, and poor coverage of small gas and bioenergy plants across most countries.
Acknowledgements
Agora Energiewende
Report designWilf Lytton