


About
The European Electricity Review analyses full-year electricity generation data for 2021 in all EU-27 countries to understand the region’s progress in transitioning from fossil fuels to clean electricity. It is the sixth annual report on the EU power sector published by Ember (previously as Sandbag).
The report compares electricity generation in 2021 to benchmark pre-pandemic levels in 2019, providing the first insight into how the gas crisis is affecting the region’s power sector after its recovery from the pandemic.
The report compares electricity data from 2021 to both 2020 and 2019. The comparison to 2019 is a far more accurate measure of the EU’s overall progress in the transition from coal to clean electricity, than the year-on-year headline figures, which have swung down and then back up again because of the Covid-19 pandemic.
Executive summary
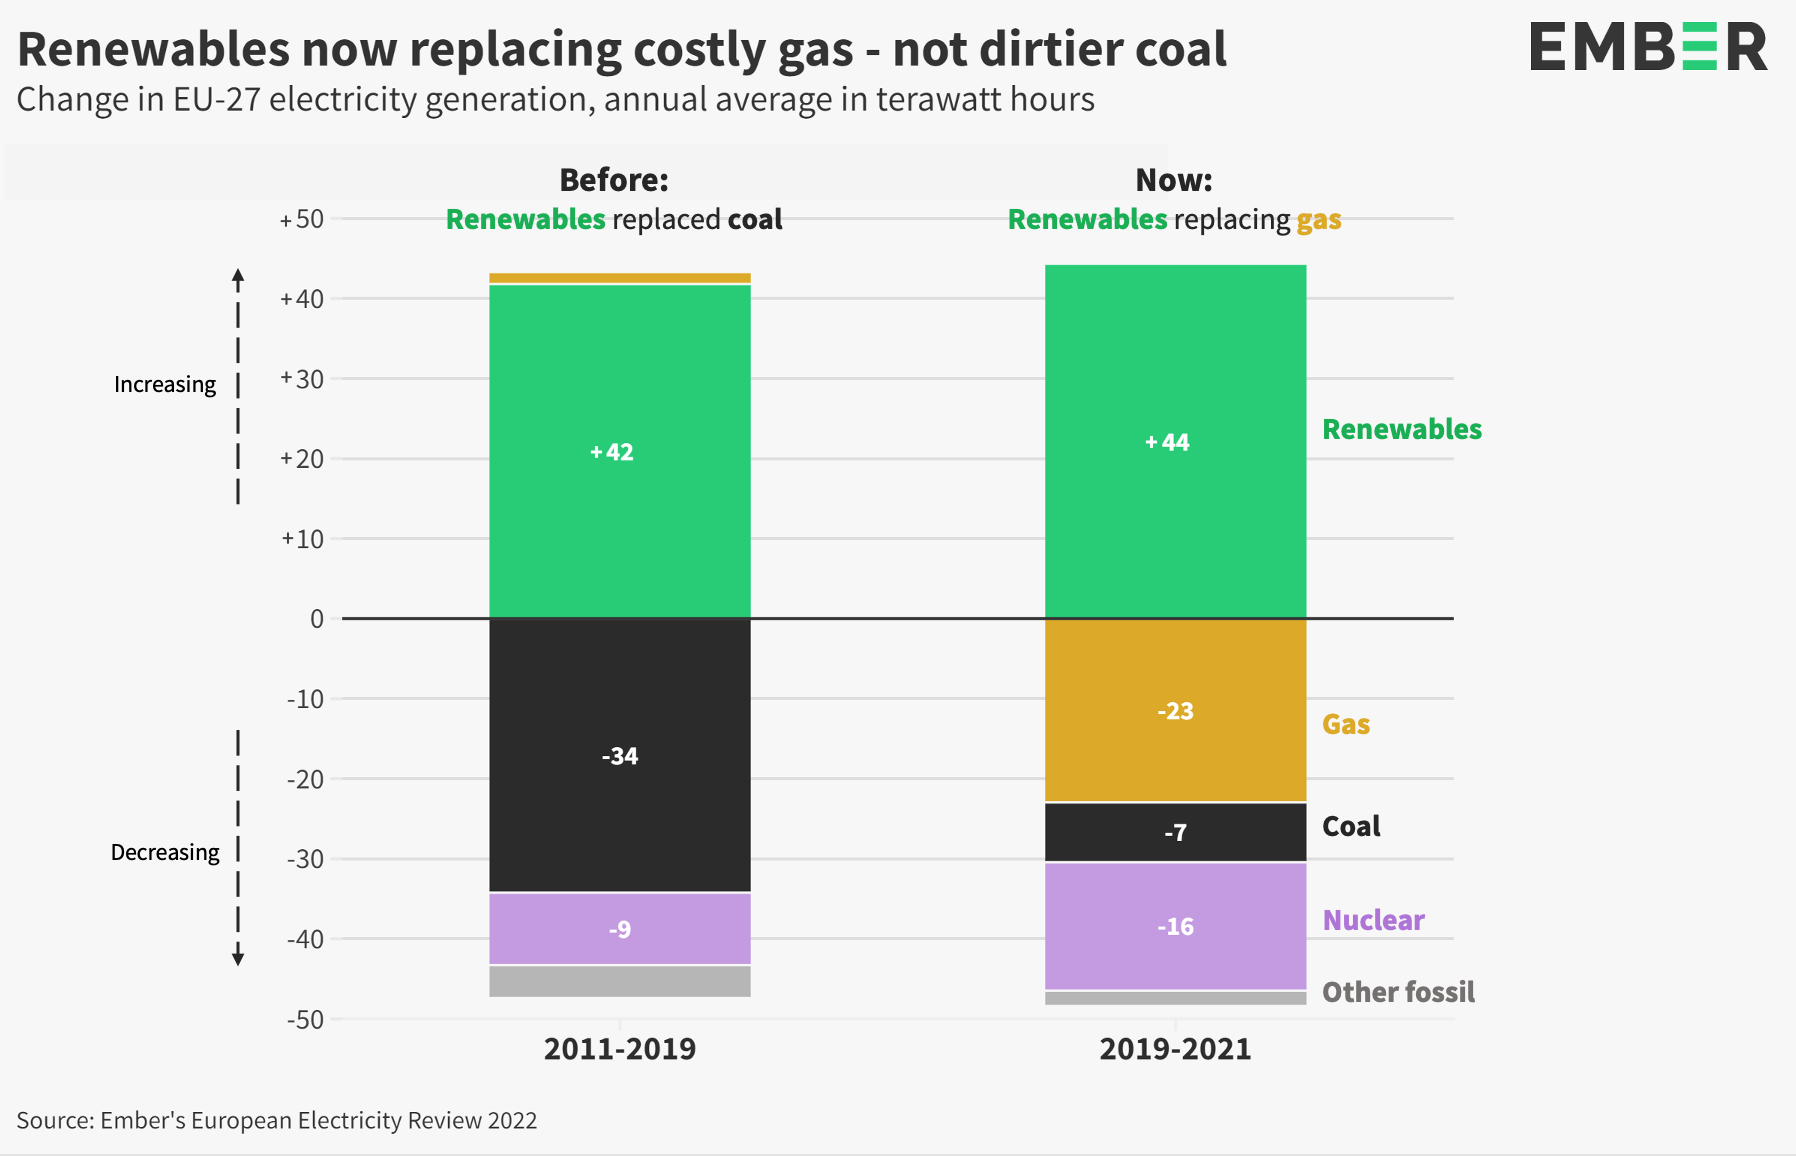
Gas crisis interrupts EU coal exit
‘Paradigm shift’ as new renewables replace costly gas instead of dirtier coal power
European Programme Lead, Ember
The gas crisis is a paradigm shift for the EU’s electricity transition. Action is needed to ensure Europe’s coal phase-out stays on track. Legislation is the only way to guarantee that coal plants are closed by 2030; volatile gas prices have made it clear that you cannot rely on market forces alone. It is a huge wake-up call. Both coal and gas need to go; and fast. The benefits to the economy and the climate are clearer by the day. Keeping 1.5C within reach requires a massive step up in renewables to ensure that all fossil fuels are off the grid by 2035. Now is the moment to double down on Europe’s transition to clean electricity.

Headline Trends
EU-27 Power Sector in 2021
In this chapter:
Emerging Trends
Insights from 2021
In this chapter:
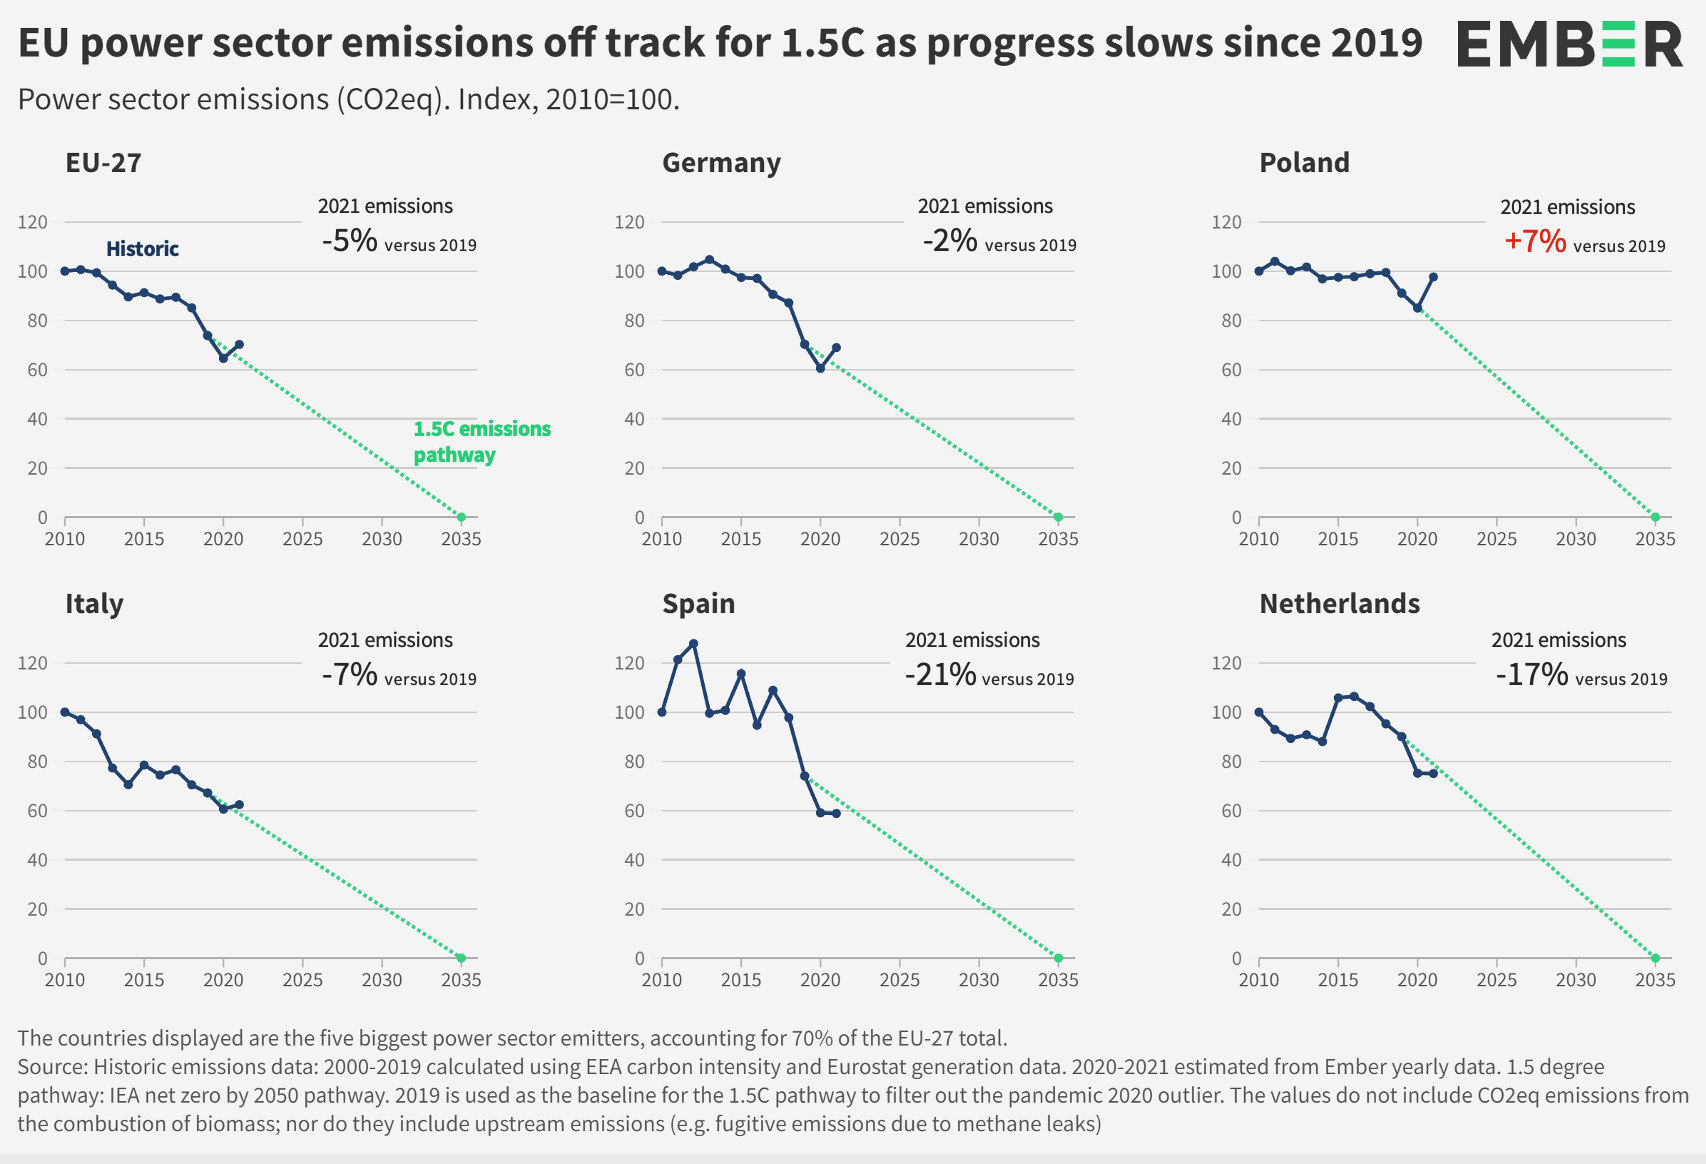
If nuclear remains in structural decline, policy makers will need to ensure that wind and solar deployment plans and further efficiency measures are sufficiently ambitious to both replace lost nuclear output and phase out fossil fuels at the speed required to stay on track for 1.5C.
Data Explorer
Dig into the data
Conclusion
Relying on fossil gas is no longer a credible energy strategy
While futures prices indicate that the gas crisis may abate by 2023, there’s a growing risk that it will extend further into the 2020s. The crisis has laid bare the inherent risks of energy strategies overly reliant on fossil gas as a “transition fuel”. Similarly, the crisis is an important reminder that carbon pricing and market forces alone cannot guarantee a timely coal phase- out.
To ensure that coal is phased out by 2030, as is required to stay on track for 1.5C, it is essential that policymakers legislate to close coal power stations by this date. In parallel, they should also bring forward a policy framework which will secure clean energy infrastructure and efficiency investments at the speed and scale required to phase out both coal and fossil gas from electricity supply and deliver a clean electricity grid across Europe by 2035.
Supporting Material
Methodology
Generation
A complete country-by-country methodology is available for download here.
The data in this report is curated by Ember. The full dataset is available to download. Please address any data queries to [email protected].
Annual data from 2000 to 2019 is gross generation, published by EUROSTAT. More recent data is an estimate of gross generation, based on net generation gathered from monthly data. This estimate is calculated by applying absolute changes in net generation to the most recent gross baseline.
Monthly data is gathered from a number of sources, including both centrally reported ENTSO-E data and directly reported national transmission system operators. In some cases data is published on a monthly lag; here we have estimated recent months based on relative changes in previous years. These cases are flagged in the dataset.
Monthly published data is often reported provisionally, and is far from perfect. Every effort has been made to ensure accuracy, and where possible we compare multiple sources to confirm their agreement. In the case of Malta we were not able to gather monthly data of a high enough quality for publication, so we have repeated the 2019 EUROSTAT value for recent years.
Capacity
Historic (2000-2020): Annual installed capacity data is taken from two sources: IRENA and Global Energy Monitor (GEM). All capacity data for coal and gas is from GEM. Unit level coal and gas data is aggregated to create annual totals by country. All data for renewable sources, nuclear and other fossil is taken directly from IRENA. Other fossil data is incomplete for some countries, as IRENA’s data contains some undefined capacity that couldn’t be mapped to a fuel. All captive and off grid capacity is included, as well as on-grid installations.
Forecast (2021): 2021 installed capacity estimates for wind and solar were taken from the IEA Renewables Data Explorer, using the accelerated case. Nuclear forecast capacity data (2022-2026) was taken from the World Nuclear Association.
Emissions
Historic (2000-2019) direct greenhouse gas emissions from the power sector in the EU and by country are calculated as the product of greenhouse gas emission intensity of electricity generation from the European Environment Agency (EEA) and Eurostat’s gross electricity production. 2020 and 2021 EU direct greenhouse gas emissions from the power sector are estimated by calculating the percentage change in emissions between 2019 and both 2020 and 2021 using standard emissions factors and Ember’s generation dataset – and then applying the calculated percentages to the historic EEA/Eurostat dataset described above. The standard (direct) emissions factors are as follows:
- Hard coal 830gCO2eq/KWh
- Lignite 1100gCO2eq/KWh
- Fossil gas 370gCO2eq/KWh
- Other fossil fuels 700gCO2eq/KWh.
The standard emissions factors reproduce recent historic emissions at an EU level, however, for a number of reasons these values will not be completely accurate at a country level. In particular, thermal plant efficiency and the carbon content of fuels varies by country, therefore country estimates have a lower confidence than the EU-wide estimates.
N.b. due to the methodology used by the EEA for the historic dataset, the values do not include CO2eq emissions from the combustion of biomass; nor do they include upstream emissions (e.g. fugitive emissions due to methane leaks).
Emissions intensity
Historic (2000-2019) data from the European Environment Agency (EEA). 2021 is estimated using the same approach used for emissions described above.
N.b. due to the methodology used by the EEA for the historic dataset, the values do not include CO2eq emissions from the combustion of biomass; nor do they include upstream emissions (e.g. fugitive emissions due to methane leaks).
Definition of renewable energy
In this report, for ease of comparison with EU targets, ‘Renewables’ mean all technologies treated as renewable in the EU Renewable Energy Directive i.e. wind, solar thermal and solar photovoltaic, geothermal energy, ambient energy, tide, wave and other ocean energy, hydropower, biomass, landfill gas, sewage treatment plant gas, and biogas. However, recent scientific evidence shows that many forms of bioenergy risk significant carbon emissions. Given the availability of risk-free alternatives to generating electricity such as wind and solar, countries should aim to minimise or eliminate the inclusion of large-scale bioenergy in the power sector.
Electricity generation costs
The following values have been used to calculate fossil fuel generation costs.
- Plant efficiency rates – Fossil gas: 55% (Lower Heating Value); Hard coal: 40%; Lignite: 37%
- Carbon intensity – Fossil gas: 0.37 tCO2eq/MWh; Hard coal: 0.83 tCO2eq/MWh; Lignite: 1.10 tCO2eq/MWh.
- Variable operating and maintenance costs for Short Run Marginal Costs – Fossil gas, hard coal and lignite: €2/MWh.
- Fuel prices – Fossil gas: Dutch Title Transfer Facility (TTF); Hard coal: API2 Rotterdam coal; Lignite: €1.50/MWh