

About
Although the first case of coronavirus in Europe was confirmed almost 2 months ago, it was only in the last 10 ten days that the crisis has gradually paralysed Europe.
Therefore, we thought a one-off deep analysis of week-on-week changes would give a good idea of how this has started to already impact electricity demand across Europe. We went through the additional step of weather-correcting the demand data to make the comparison more robust. Obviously, this is really early into the disruption, so constant monitoring will be needed to track how this changes.
Executive summary
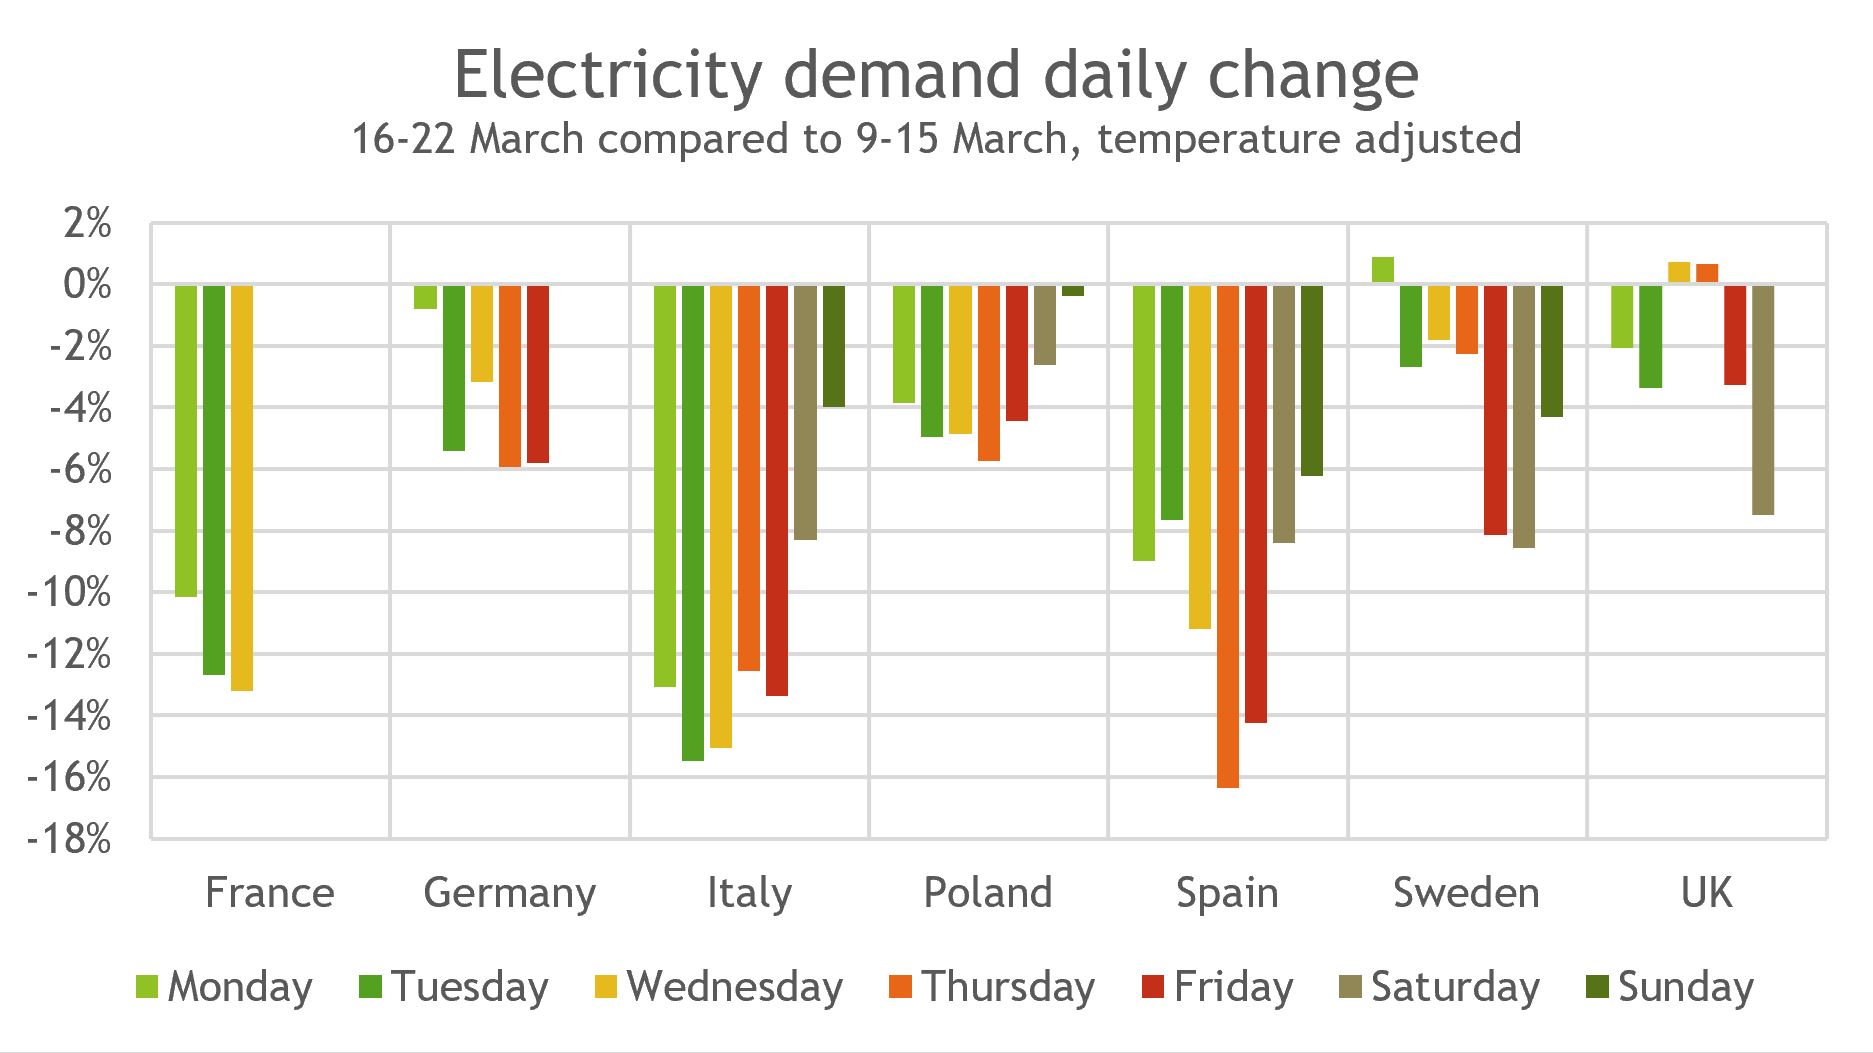
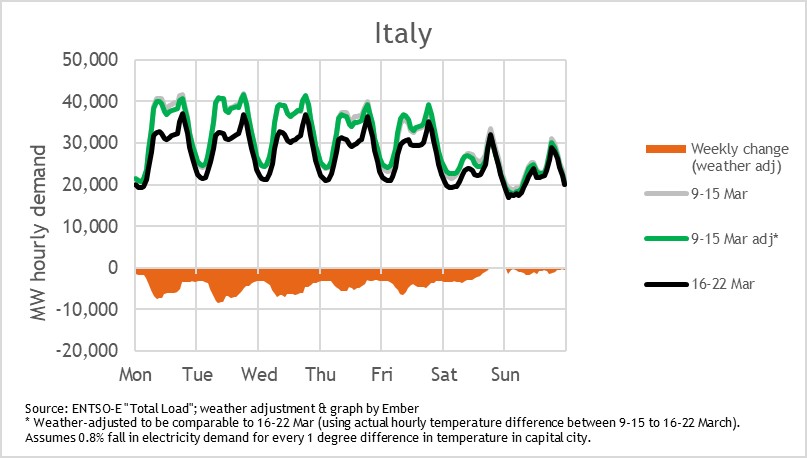
Italy, France and Spain have been most affected
UK electricity demand has been least impacted so far

Electricity Analyst, Ember
Data plays a vital role in how we optimise our response to the coronavirus. Something as seemingly banal as electricity demand provides some insights into our response and its impacts. More than ever, we need this data and analysis in the open public domain, not behind paywalls. We would urge all organisations to put data and analysis into the public domain so that we can all respond more effectively to the pandemic.

EU Electricity Demand
Country-by-country analysis


Conclusion
Outlook
It is still really early into the disruption, so constant monitoring will be needed to track how this changes. We shouldn’t read too much from these early results.
China provides some clues that the falls will be deep and long-lasting: in Jan/Feb electricity demand was down 8% year-on-year. Since the Wuhan lockdown only started at the end of January, this is more likely to be a national demand impact of around 16% in February. Hubei still has electricity demand 30% below the level compared to last year, two months after the lockdown began.
Supporting Material
Methodology
Methodology
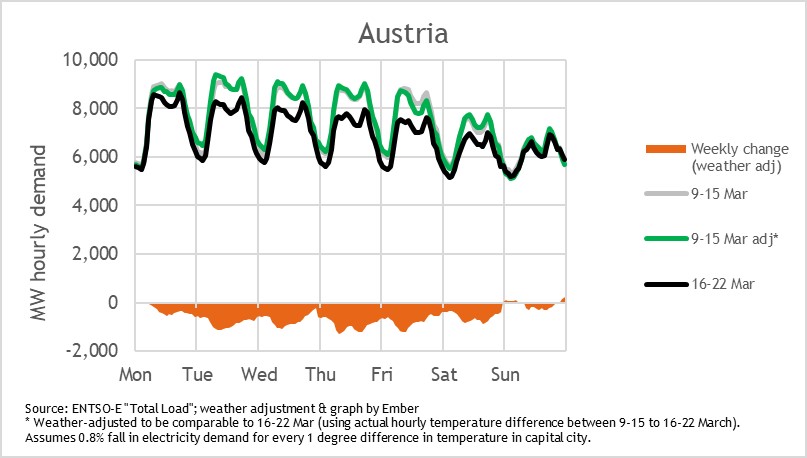
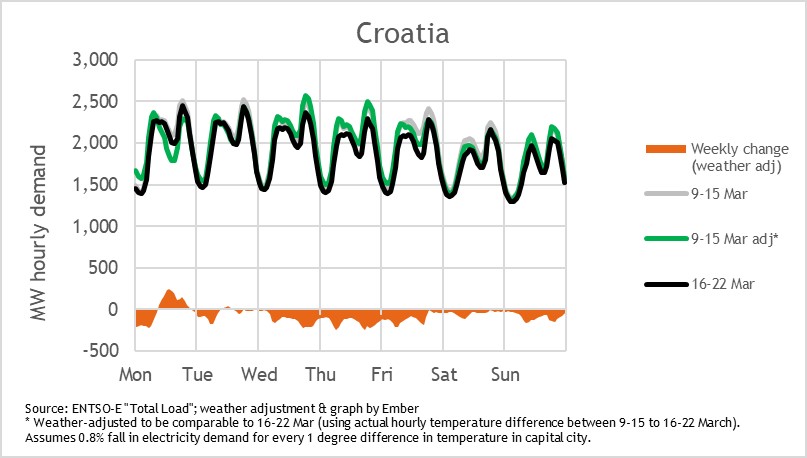
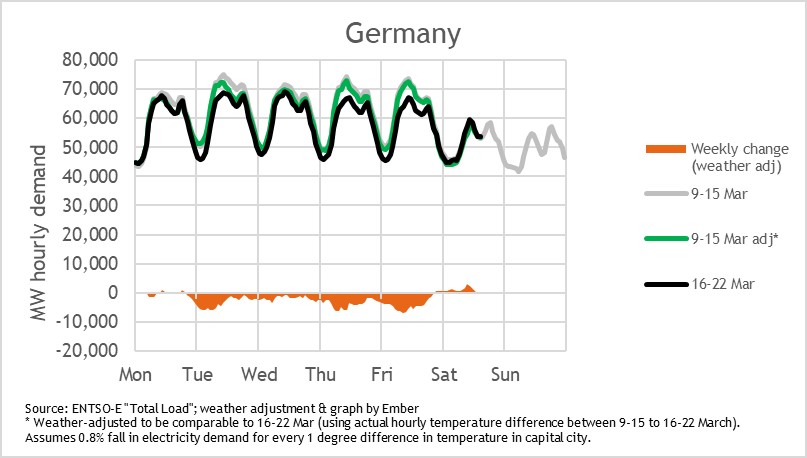
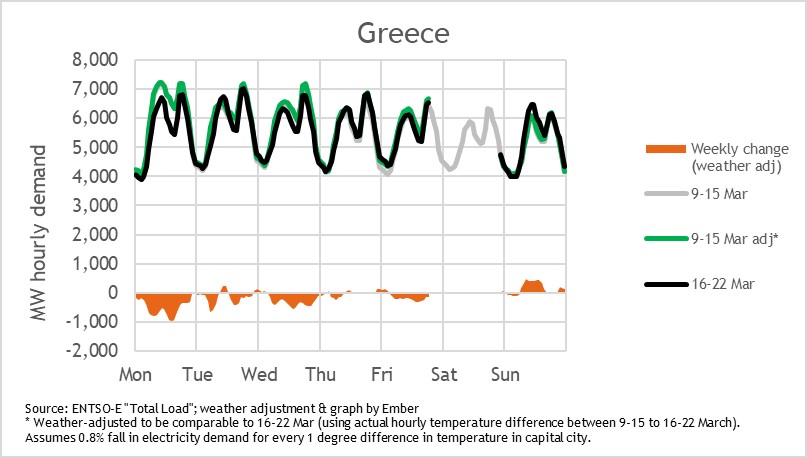
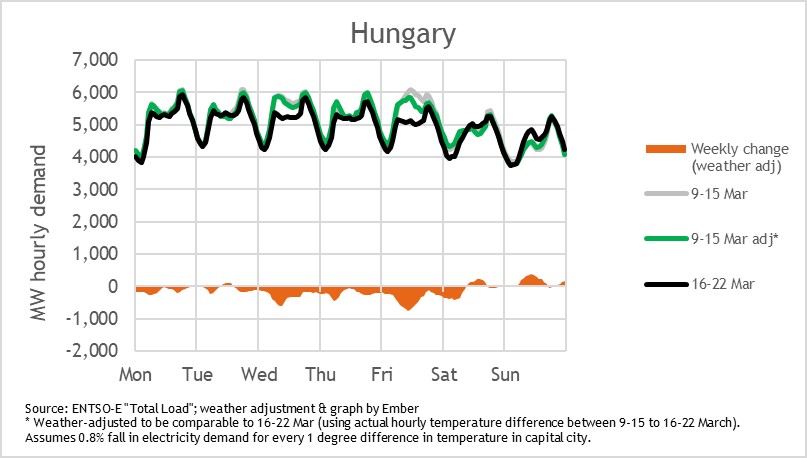
We took electricity demand data from ENTSO-E (they call it “total load”). This is data aggregated from local system operators across Europe. We performed a weather correction for temperature (the data already should strip out all distributed generation including wind and solar generation, so reflect pure electricity demand). We manually copied the historic capital temperatures from TimeandDate. The colder the temperature, the higher electricity demand should be, so we adjusted electricity demand by 0.8% for every degree from the same hour from the week before. This regression is roughly in line with historic analysis for the UK and Italy (especially in context of the 5-15 degree range of mean temperatures for the last fortnight). France shows a bigger temperature sensitivity there due to high use of electric heaters; so we adjusted demand by 2.5%/degree.
Note: The week-on-week weather temperature change was small across Europe, except for Spain which saw 5 degree cooler temperatures last week, so this is not a critical step.
Country notes:
- France: ENTSO-E has not yet reported data beyond Wednesday lunchtime.
- Germany: ENTSO-E did not report data for the weekend yet. See the pick-up in falls from Thursday, which coincided with more announcements of industries – particularly the car industry – closing down,
- Italy: Note there were big falls prior to the Thursday from the week before – there is a graph in the summary above which included the previous week of 2-8th March.
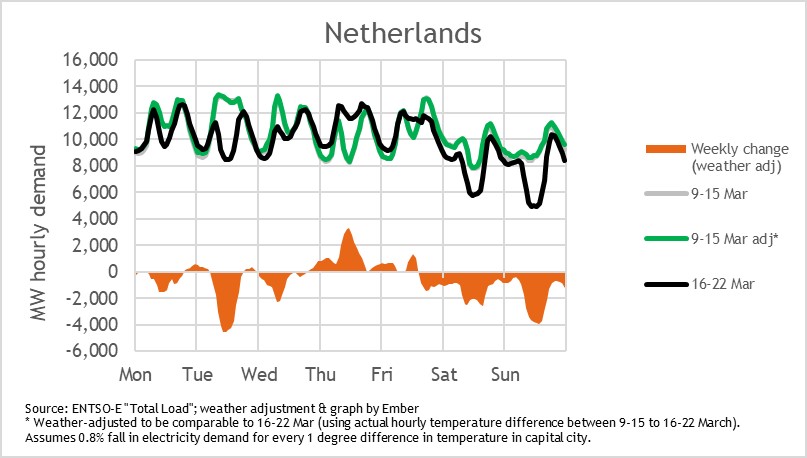
- Netherlands ENTSO-E load data may not be reliable.
- Spain: note the biggest falls seem to be in the morning, maybe a shift of routine? There were big temperatures changes in Spain last week, with every day in Madrid being about 5 degrees cooler than the week before, therefore the weather-adjustment we have made is quite critical here.
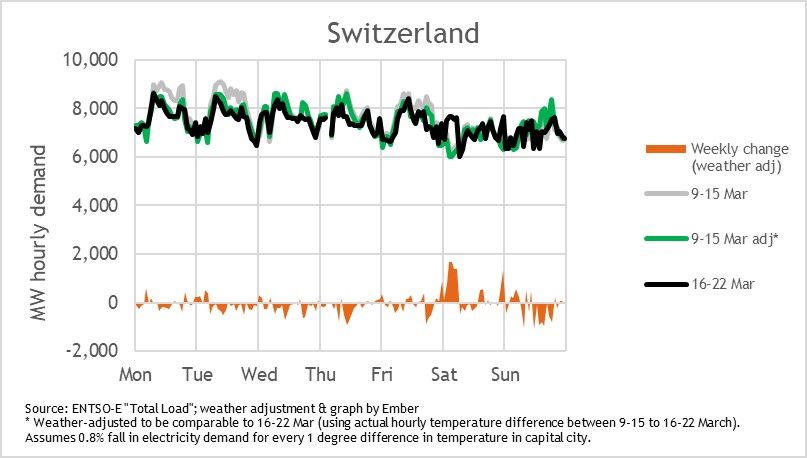
- Switzerland: saw small falls, but with a big increase in Saturday early morning confusing the overall weekly averages.


