
Global Wind & Solar Review
Ember's review demonstrates how wind and solar are ready to lead the global coronavirus recovery.
Pete Tunbridge
7 July 2020 | 4 min read
Available in: 简体中文
About
Executive summary
Wind and solar are ready to lead the global coronavirus recovery
As countries start entering Covid-19 recovery phases, governments are presented with a unique opportunity to step up wind and solar investment.
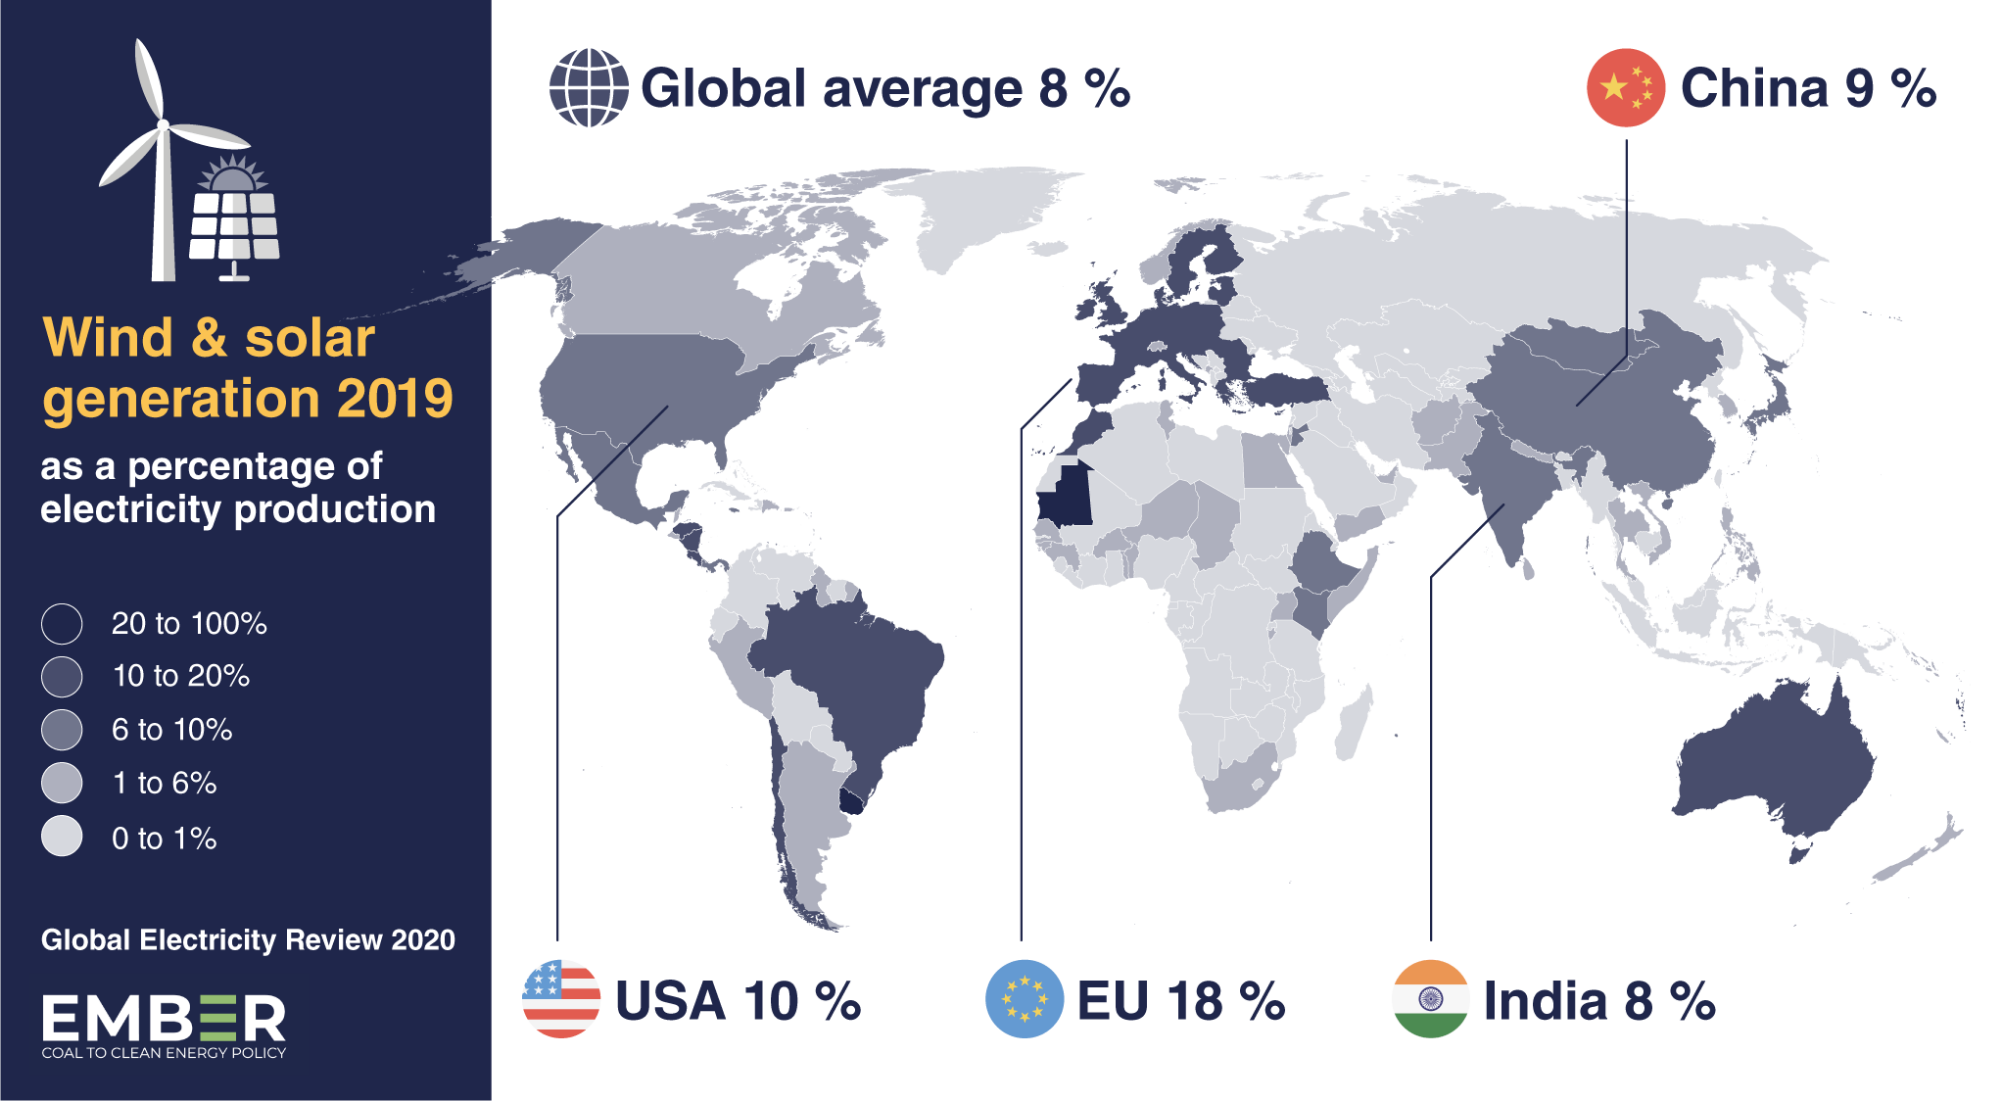
How much of the world’s electricity came from just solar panels and wind turbines last year? Take a guess!
Wind and solar generated 8.2% of the world’s electricity in 2019. China, USA and India were very slightly above the global average. The EU leads the way, generating 18% of its electricity from wind and solar – more than double the global average – and as high as 55% in Denmark. Countries that you probably wouldn’t expect are also among the leaders: Australia 15%, Morocco 17%, and Uruguay at an impressive 38%. Globally, wind generated more than solar, with a split of 5% and 3% respectively. But solar is catching up, thanks to its rapid growth in the last few years.
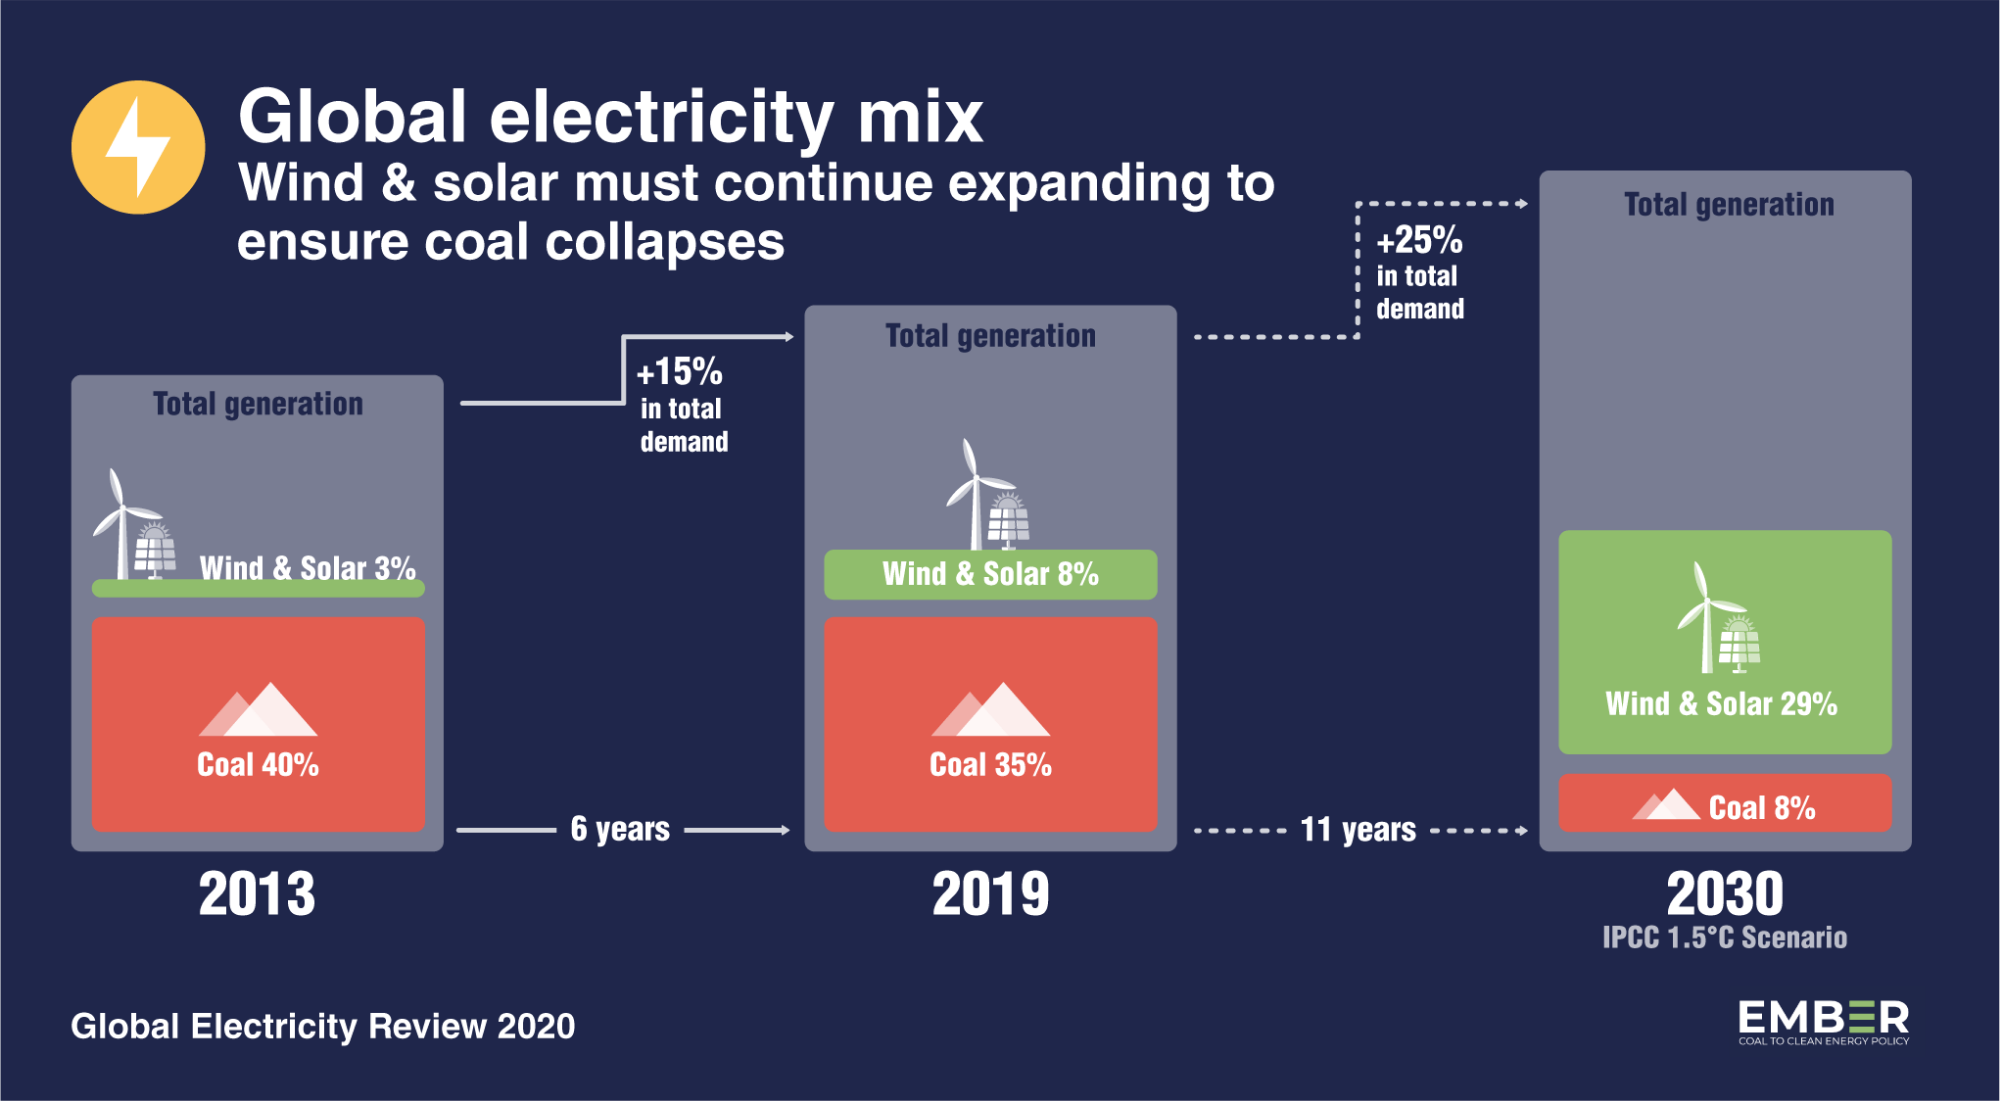
The growth in wind and solar generation has happened quickly, more than doubling in just 5 years: from 3% of the world’s electricity demand in 2013, to 8% in 2019 (see graphic below). This rise in five percentage points has fed more-than-less directly into coal, reducing coal’s market share from 40% to 35% in just six years.
But we will need a lot more wind and solar – firstly, to meet the world’s growing demand for electricity, especially as we move to electric cars, and secondly to reduce CO2 emissions from coal power plants. Last year, coal power plants were responsible for nearly a third of all CO2 emitted from the burning of fossil fuels; so quickly replacing them is vital to minimising climate change.
In the IPCC’s meta-analysis to limit temperature increase to 1.5 degrees, they show coal must fall from 35% market share in 2019 to just 8% in the next 11 years. Most of the models say that the most economic way to do this is by increasing 1:1 wind and solar’s share from 8% today, to around 29% by 2030. All whilst global electricity demand rises by a quarter.
The Covid-19 crisis has shown us that our electricity grids are ready for even higher levels of wind and solar market share. Our analysis published in Carbon Brief shows European electricity demand fell by 14% year-on-year in April as lock-down measures kicked in, but coal took the brunt of that because it’s the most expensive fuel, falling by over 40%. This pushed the market share of wind and solar to new highs. The April average was 65% in Denmark, 45% in Germany and 41% in Greece. Yet the electricity grids continued to operate smoothly and reliably, even with these unprecedented levels of wind and solar generation.
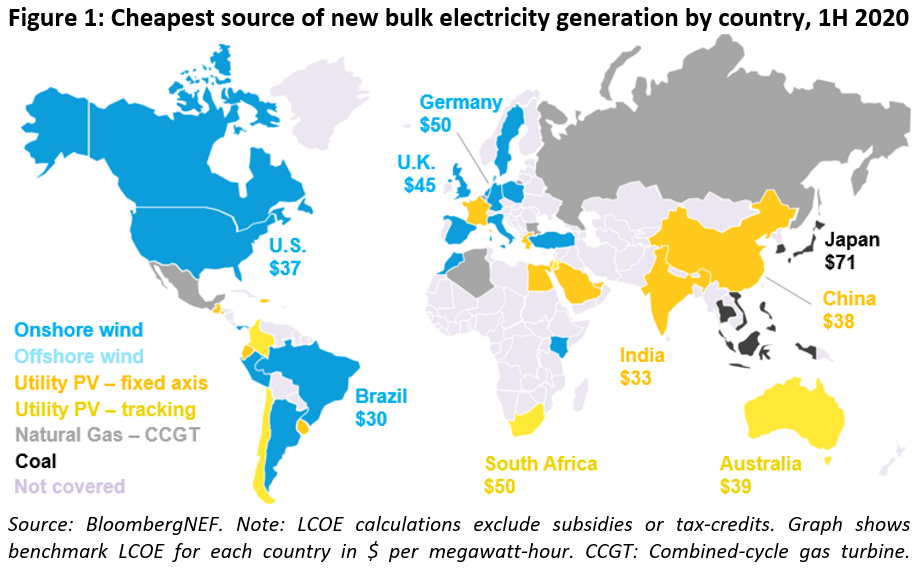
Wind and solar are now the cheapest forms of electricity in many countries. The graphic below from BNEF shows that in 2020, wind and solar are the cheapest sources of new generation for two-thirds of the global population. Analysis is increasingly showing that wind and solar can save money across whole system costs. For example, this study published in Nature Communications, shows China power sector could save 10% by 2030, by building more renewables. It also shows a more aggressive scenario, capable of cutting power sector emissions by 80% by 2030, should politicians choose to be that ambitious.
The next section shows how countries rank in different regions of the world. In March 2020, Ember published our first annual Global Electricity Review, which provides free data by country by fuel, from 2000 to 2019, which we’ve used for the following graphics. We’d love for more people to use this data resource, which we will keep updated – let us know if you do!
Wind & Solar Trends
Regional breakdown
In this chapter:
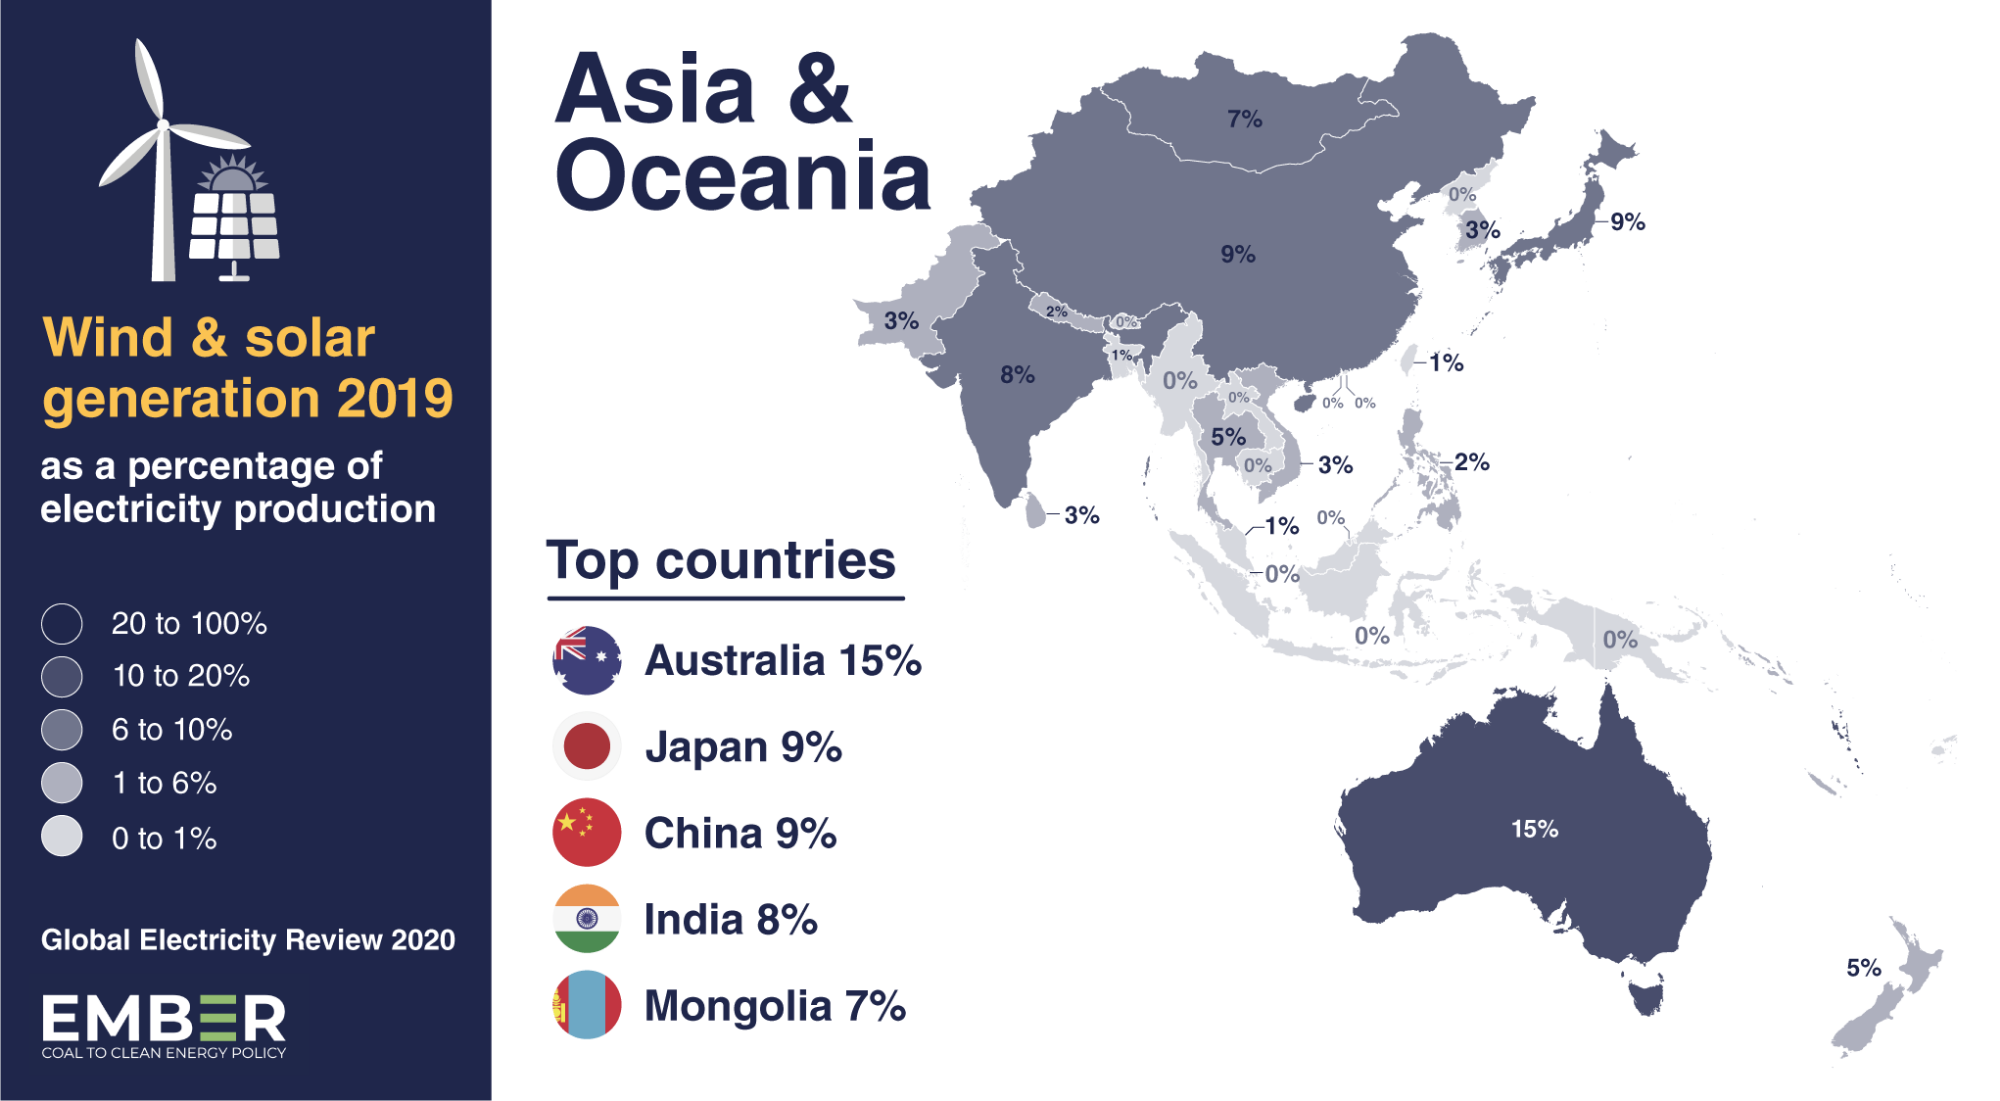
Asia & Oceania
In the region with the largest electricity demand, 7% of electricity came from wind and solar in 2019. The leading wind and solar generating nations: Australia (15%), Japan (9%), China (9%) and India (8%), are also the largest producers of electricity. Laggard nations include Indonesia (0.1%), Malaysia (0.7%) and Bangladesh (0.8%), and the map shows low shares across south-east Asia. There have been examples of rapid scale up: Australia’s wind and solar share has doubled in just 3 years, Vietnam showed the fastest growth in 2019, particularly in solar, which increased from 0 to 3% of total mix. Asia & Oceania rely fairly equally on both wind and solar, making up 4% and 3% respectively, but solar was responsible for the majority of growth in 2019. The continued development of wind and solar power is key to ending Asia & Oceania’s dependence on coal.
Africa
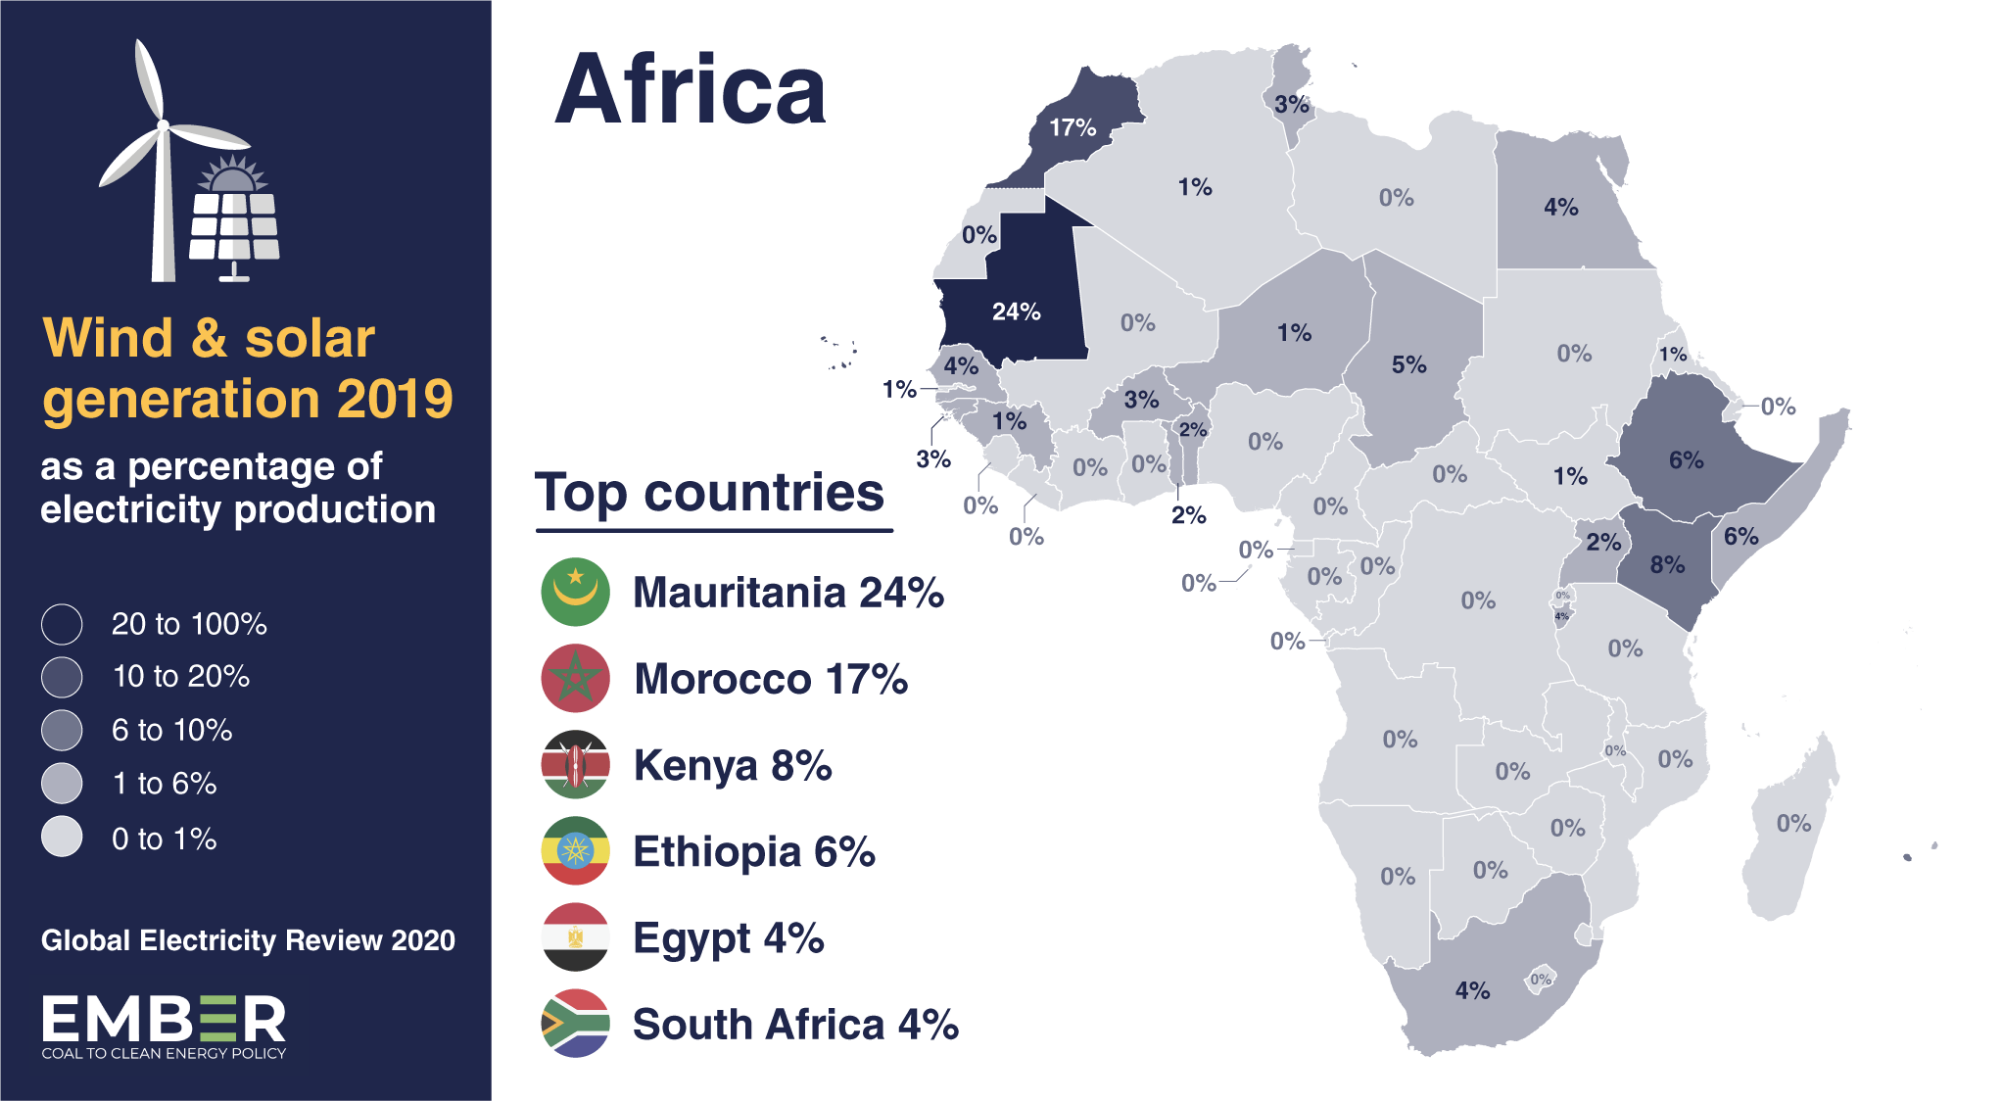
Africa had 3% wind and solar in its electricity mix in 2019, which was below the global average. Leading the way were Mauritania (24%), Morocco (17%), Kenya (8%) and Ethiopia (6%). South Africa and Egypt were the two largest countries in terms of electricity demand, and both only had 4% wind and solar. Despite having a low percentage share, Egypt had the fastest growth in solar in 2019, more than tripling its annual generation. Morocco has also seen a large increase in solar generation, due to the completion of the 530 MW Noor Ouarzazate solar plant.
Europe
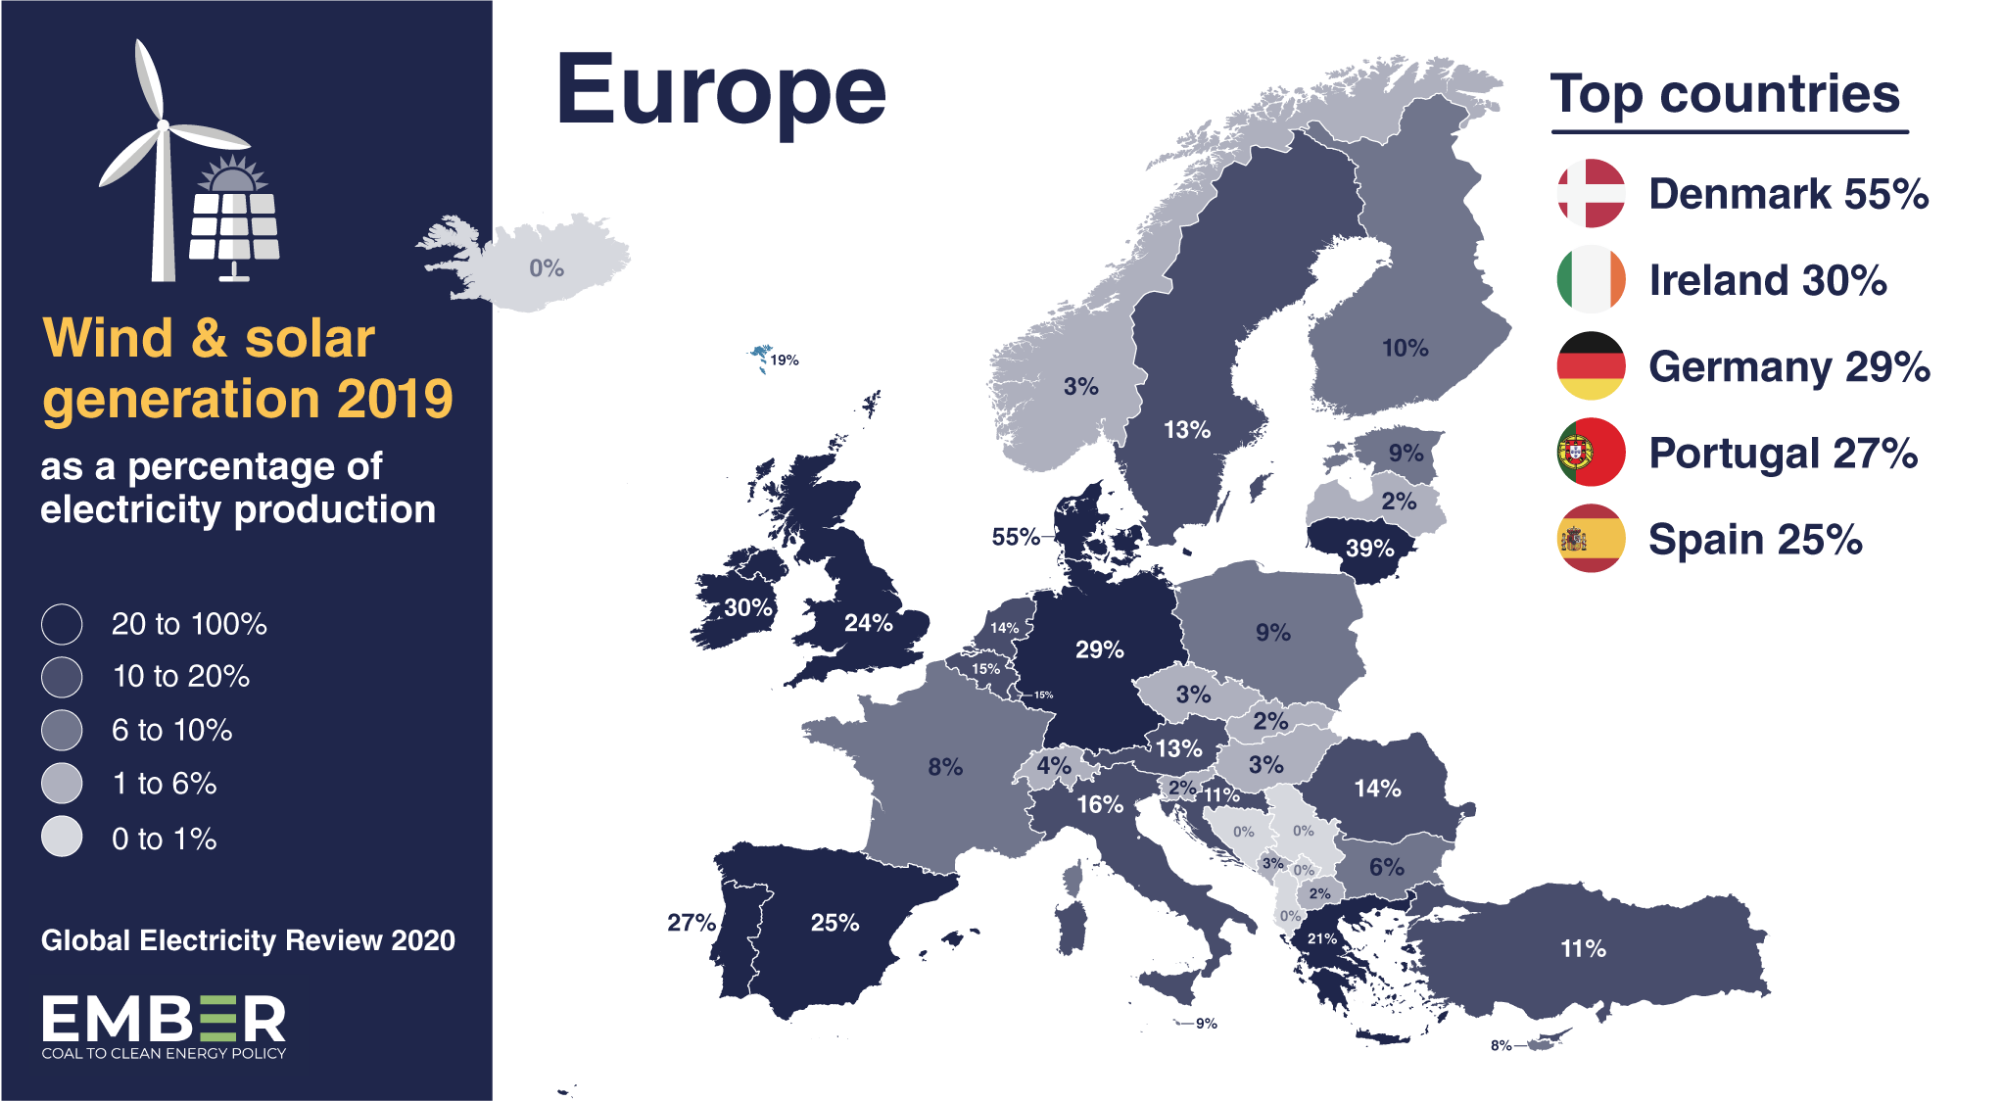
Europe is the leading region for wind and solar generation. The EU-28 has wind and solar making up 18% of the mix – over double the global average. Denmark are clear leaders, with 55% of electricity from wind and solar, growing 7 percentage points in 2019. Ireland, Portugal and Germany are also above the global average with 30, 27 and 29% respectively. Some countries are still far behind, however. Serbia (0%), Slovakia (2%) and Slovenia (2%) stand out, with very low wind and solar penetration.
Wind power is the major contributor, as Europe generated three times more electricity from wind than solar in 2019. Wind is also being scaled up faster than solar, in contrast to the rest of the world. The UK and Germany are leading the charge for scaling up wind power, both increasing their market share by 10 percentage points in just 3 years!
North America
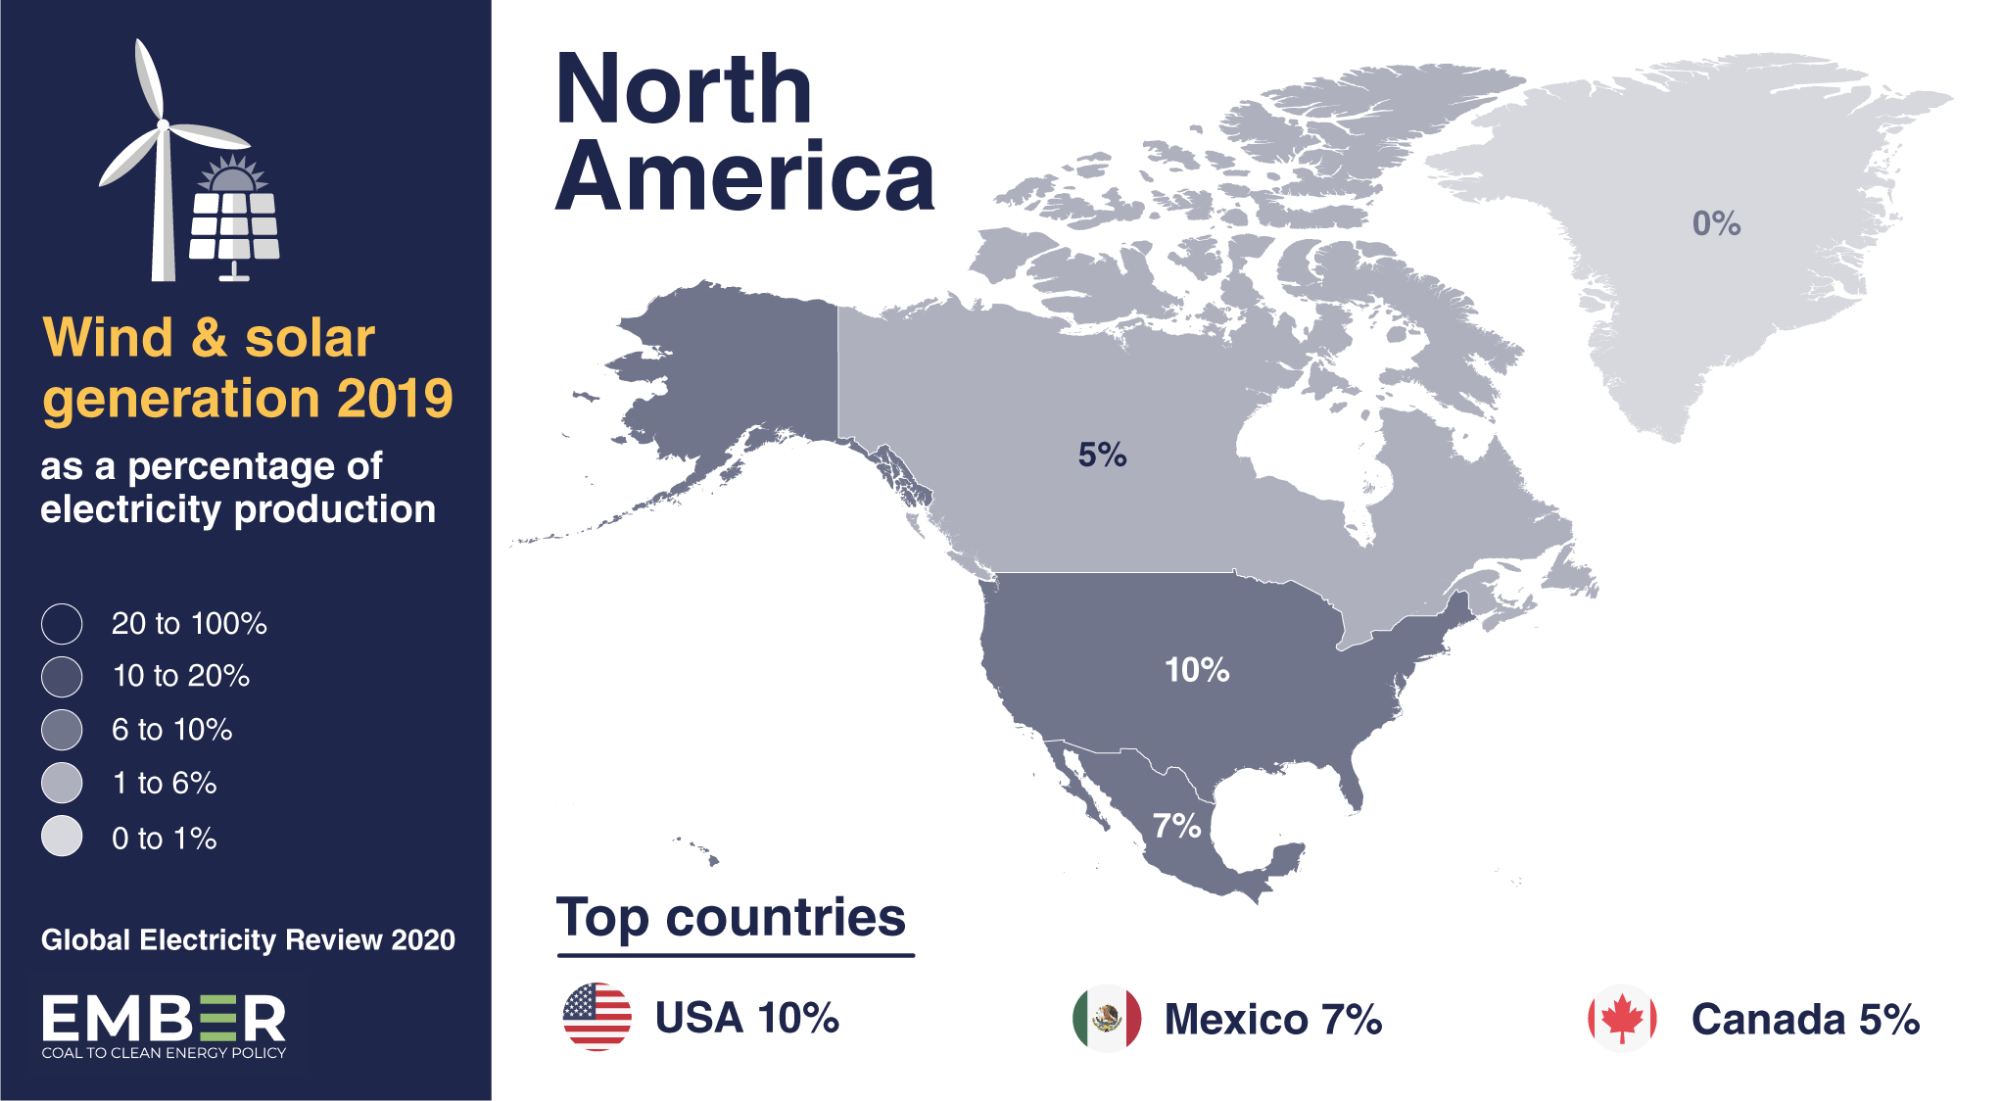
The USA leads the way in North America, with 10% wind and solar in 2019. However, Mexico is building new wind and solar the fastest, as their percentage share has doubled since 2016. Canada has both the lowest percentage share and the slowest growth, despite having vast natural resources for wind development. Wind power is far more prevalent than solar in North America. In 2019, wind power generated three times as much electricity as solar.
Central & South America
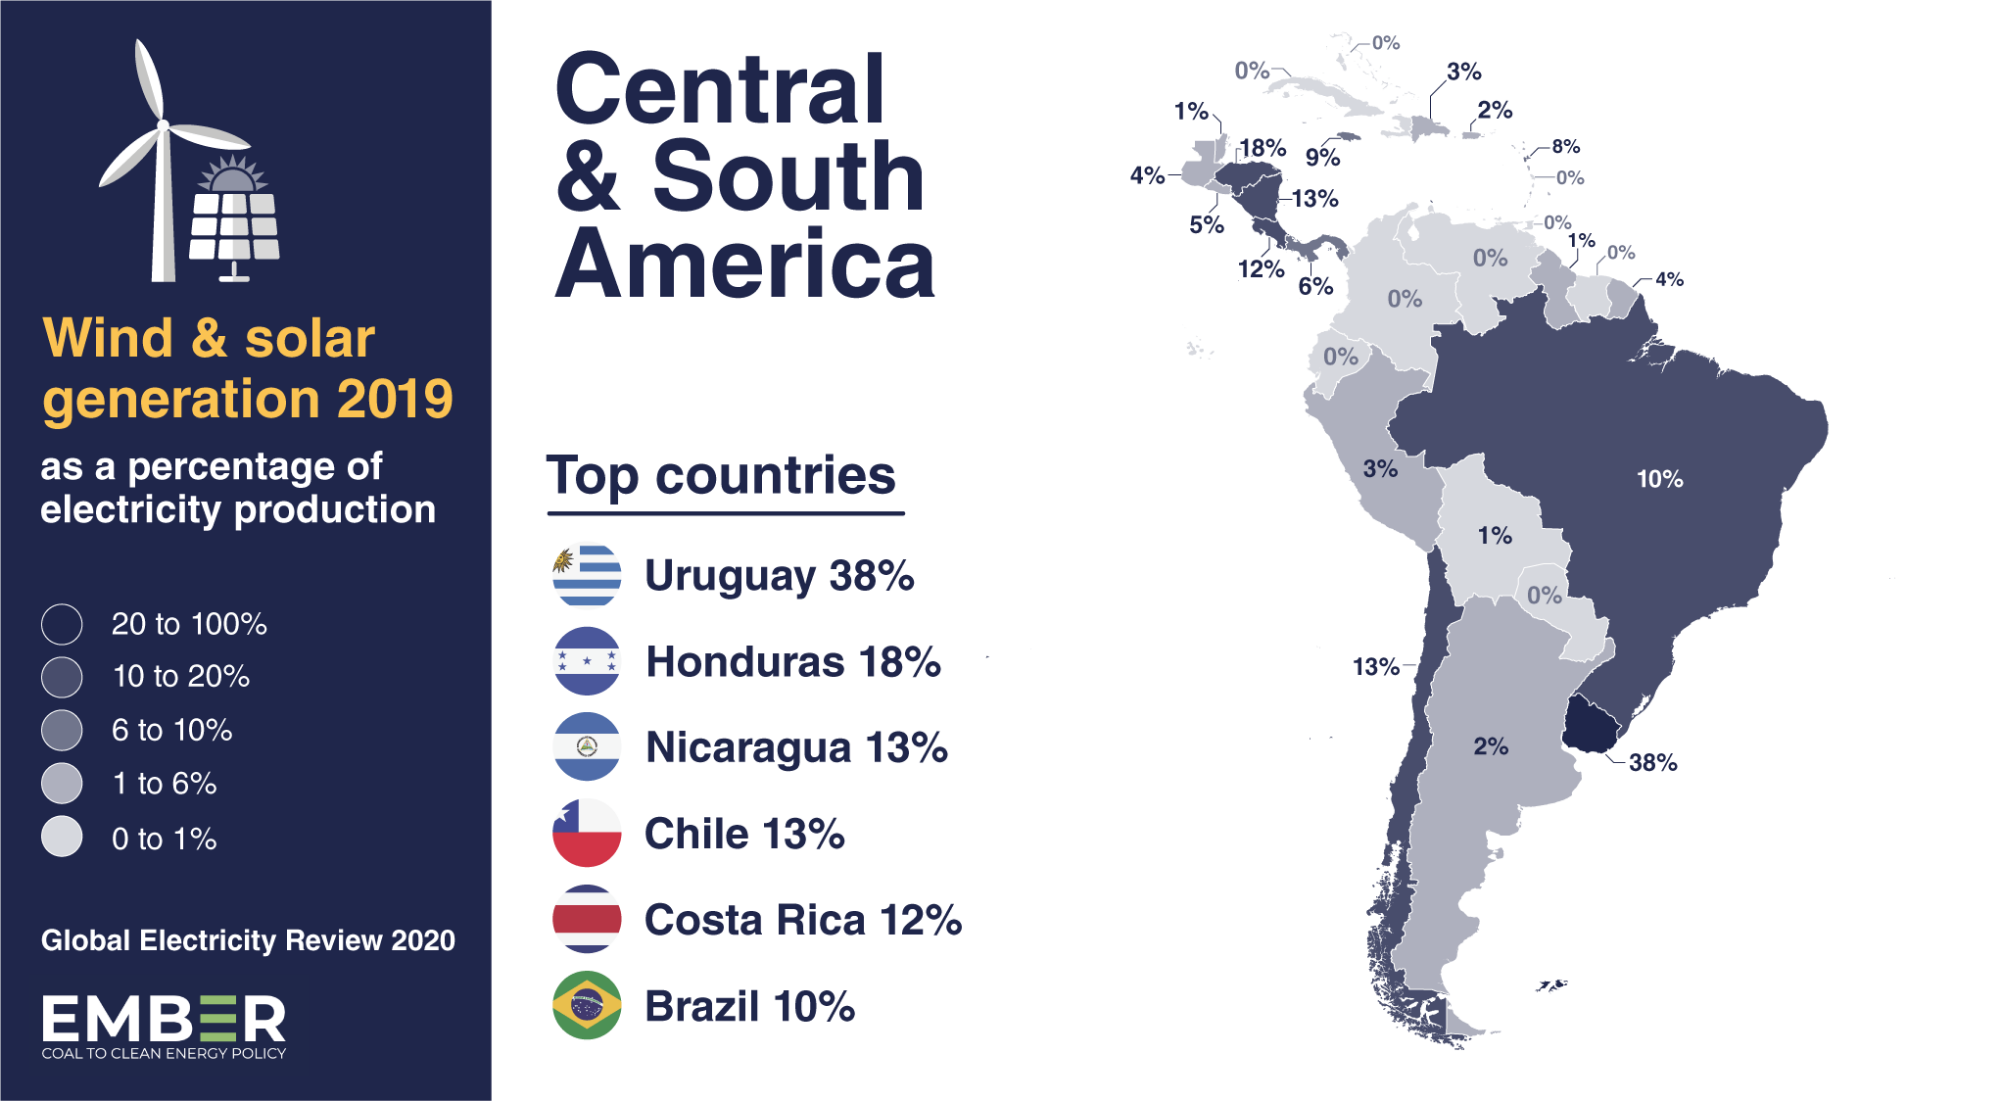
7% of Central & South America‘s electricity came from wind and solar in 2019. Leading the way were Uruguay (38%), Honduras (18%), Nicaragua (13%), Chile (13%) and Brazil (10%). Brazil is by far the leader in absolute terms, generating more wind power in 2019 than all other countries in the region combined. Some of the lowest shares were in Colombia (0%), Venezuela (0%) and Argentina (2%). Although Argentina lagged behind in terms of percentage share in 2019, it had the largest growth in capacity of wind and solar, more than doubling the size of both fleets.
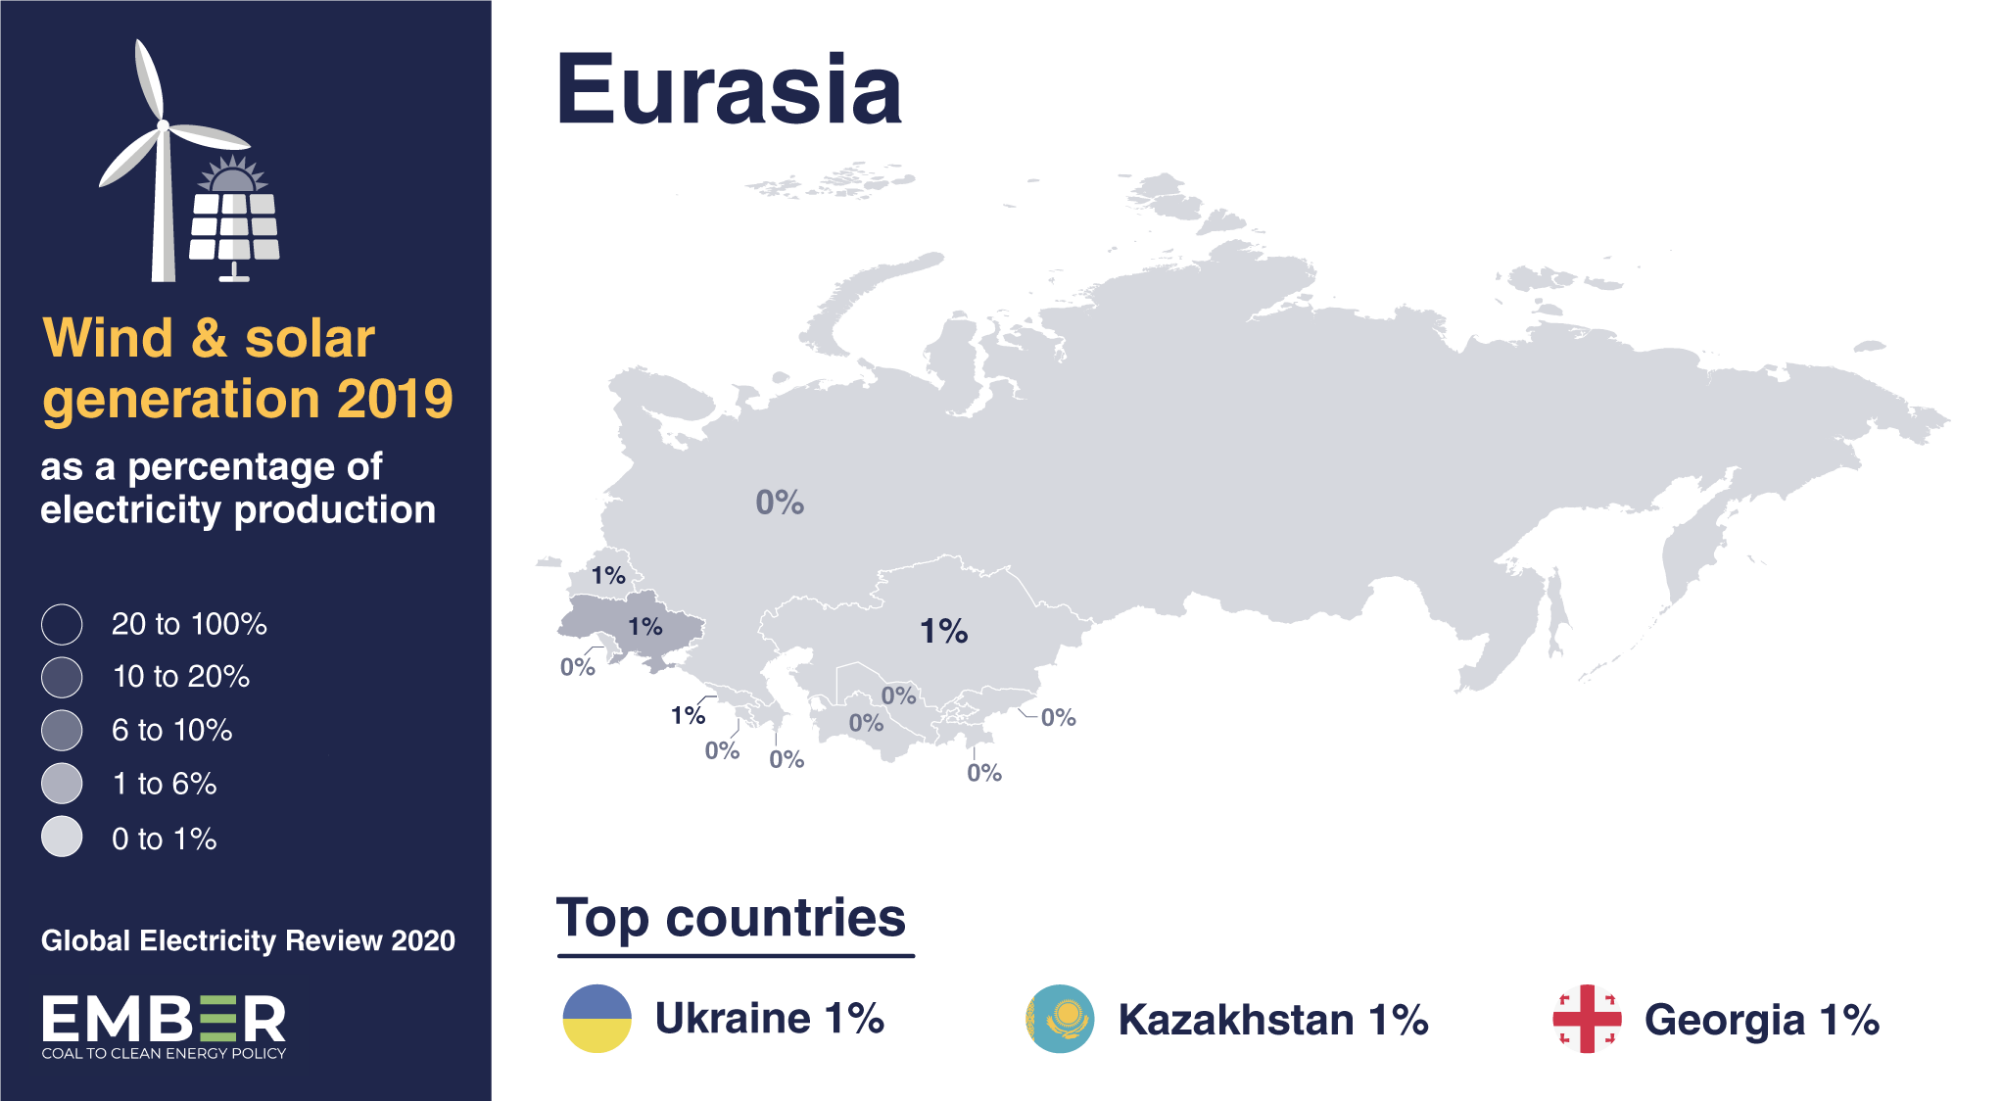
Eurasia
Eurasia is clearly out of step with the rest of the world. Russia, the 4th largest country in the world in terms of electricity demand, has 0.1% wind and solar in its mix. Ukraine is leading the way, and had large capacity additions in 2019, building 4 GW of solar power, doubling the size of both its wind and solar fleets.
Middle East
The Middle East generates only 1% of its electricity from wind and solar, lagging far behind the rest of the world. The leading nations are Jordan (9%), Yemen (5%), Israel (3%) and the United Arab Emirates (UAE) (3%). Key lagging countries include Iran (0.4%), Saudi Arabia (0.2%) and Iraq (0.1%). There was a scale-up of solar power in the Middle East in 2019. UAE added 1.3 GW of solar, more than tripling their fleet size. Saudi Arabia and Israel broke records by adding 0.3 and 0.4 GW of solar respectively in 2019.

Supporting Material
Acknowledgements
Graphics made by Designers For Climate. Capacity data from IRENA.
Social Media
NEW GRAPHICS: See the leaders and laggards in the race to build #wind and #solar!
— Ember (@EmberClimate) July 7, 2020
Did you know wind turbines and solar panels already produced 8% of all the world’s electricity last year? 🌞💨
But how much in each country? *THREAD* https://t.co/JvbCRTWqHn pic.twitter.com/E7Sx00Q8vY


